Which stocks the concentrated money is crowded into
Crowding, rotation and ownership overlap, derived from every 13F filer on EDGAR.
What is Capital Network?
Capital Network takes data OpticAlpha already collects elsewhere, every 13F filer on EDGAR, Form 4 insider filings, and disclosed congressional trades, and builds a second layer on top of it: not what any single fund did, but where the concentrated money is clustered together. Every ticker gets a crowding score that blends how many "hedge-like" filers hold it against how heavily each of them weights it inside their own book, rebased each quarter so the score compares within that quarter rather than as an absolute number over time.
That leaderboard has a companion shift view showing how crowding moved from the prior quarter: climbing because more funds piled in, climbing because the existing holders concentrated harder, or falling because the crowd thinned out. Selecting a fund from the leaderboard opens its own rotation history quarter over quarter, what it added, trimmed, and exited, and selecting a ticker opens the funds that hold it plus the tickers most often held alongside it by that same crowd, an ownership-derived peer group rather than a sector or valuation-based one.
The same filer data also surfaces manager overlap, how much two funds' books resemble each other, and people and board interlocks, two companies sharing a director or officer, pulled from Form 4 filer records. An ego-scoped graph puts a single fund, ticker, or person at the center and traces its direct connections outward. None of it is new data collection, it's the same 13F, Form 4, and disclosed congressional-trade feeds OpticAlpha already runs, reprocessed into a network instead of a set of independent lists.
Four views on the same filer population
One underlying dataset, reprocessed into a leaderboard, a shift view, a peer-and-overlap map, and a people graph.
Crowding Leaderboard
Every ticker held by a hedge-like 13F filer, ranked by crowding score each quarter. The most crowded name is rebased to 100, so scores compare within a quarter, not across quarters. See how it's calculated →
Rotation & QoQ Shift
How a ticker's crowding score and holder count changed from the prior quarter, plus any single fund's own added, trimmed, and exited history filing over filing.
Held Alongside & Manager Overlap
Ownership-derived peers: which tickers the same crowd of funds also holds, and how closely two funds' books overlap with each other, a different cut than a sector or valuation peer group.
People & Board Interlocks
Directors and officers who show up on more than one company's Form 4 filings, surfacing board connections between companies that a sector list won't show.
The leaderboard and graph, as they actually look
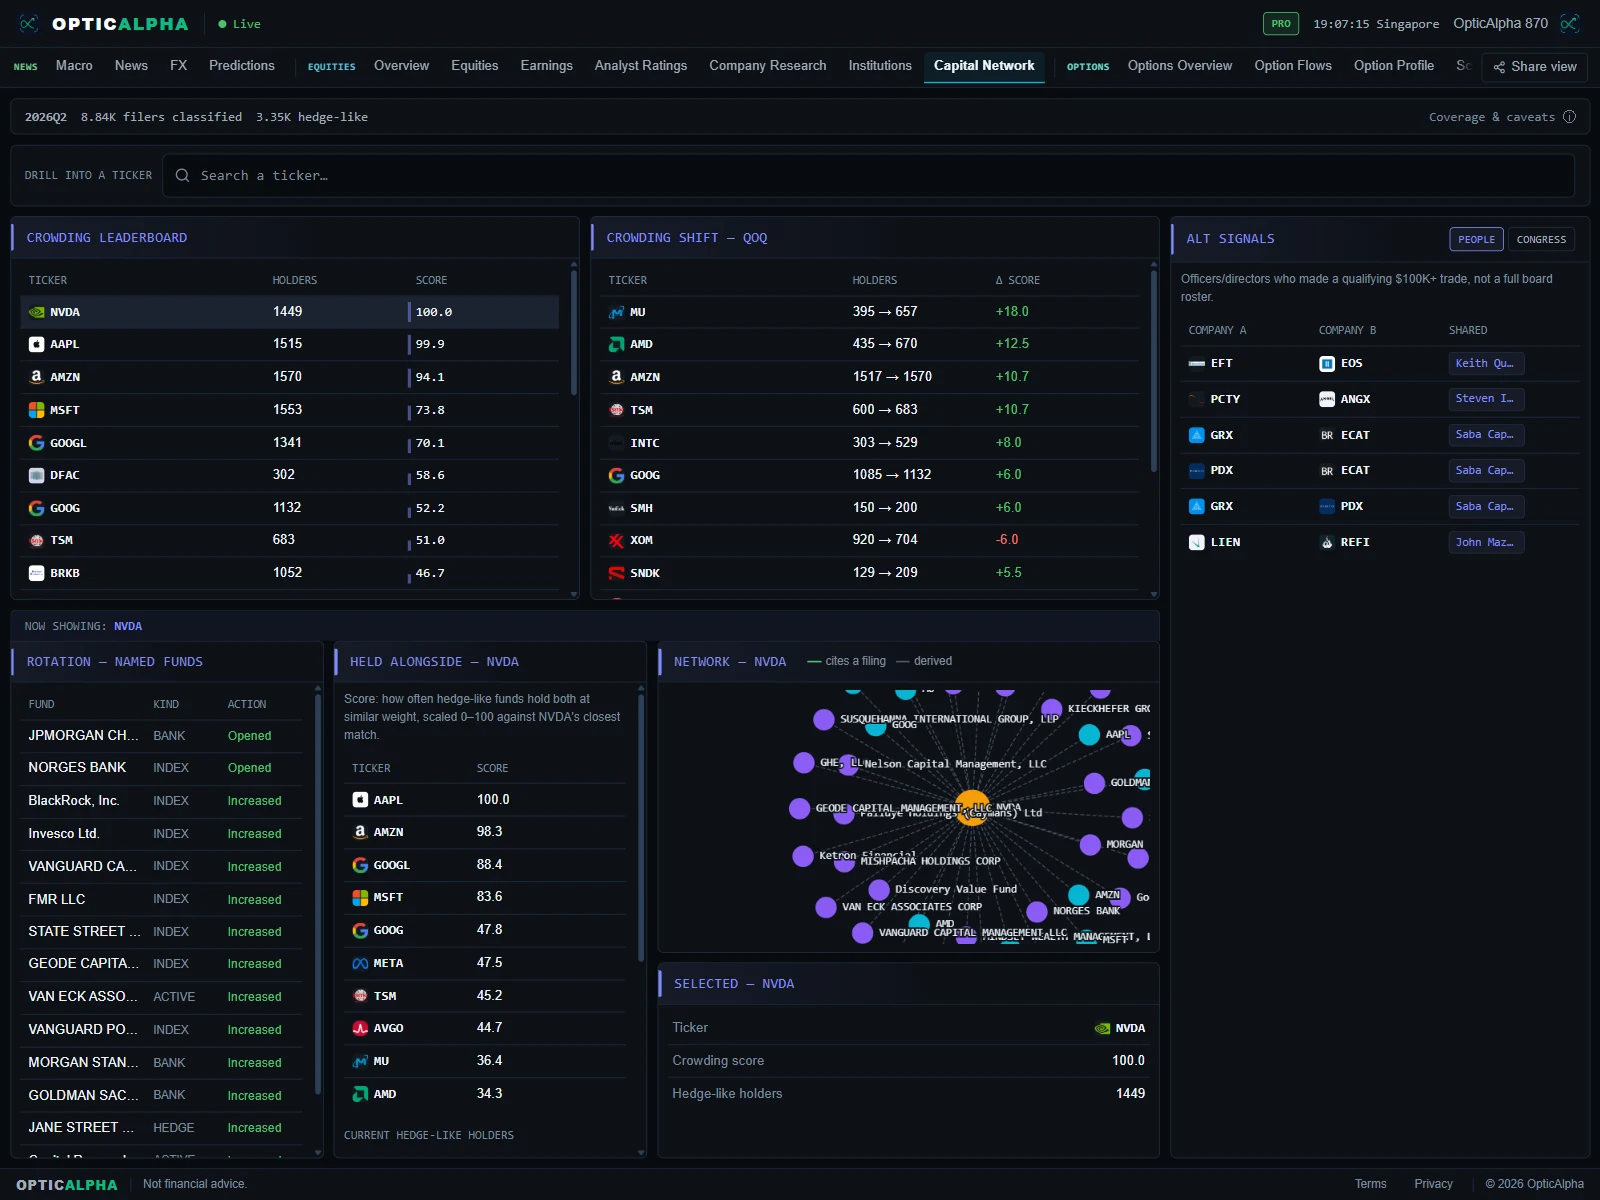
Where the crowd is, and where it's headed
The leaderboard is most useful as an early-crowding check, not a buy signal. A name near the top with holder count still climbing is where conviction money is still arriving; a name near the top with holder count flat or falling has likely already been discovered, the trade most of that crowd is going to make, they've made. The QoQ shift view catches a rotation earlier than waiting for it to show up as a top-of-leaderboard name outright: a ticker climbing fast in crowding score while still mid-table is worth watching before it becomes an obviously crowded trade everyone can see.
Held-alongside is the more durable use once you already own a position: it groups tickers by who actually owns them, not by sector or a valuation screen, so it surfaces names that are correlated because the same funds are in both, not because they share an industry label. Board interlocks serve a narrower but sharper purpose, tracing whether two companies you're researching share a director or officer is a quick way to flag related-party risk that a standalone filing read might miss.
Terms on this page
- Crowding score
- A relative 0-100 measure of how concentrated hedge-like 13F filers are into a ticker, rebased so the most-crowded name that quarter scores 100.
- Crowding shift (QoQ)
- The change in a ticker's crowding score from the prior quarter to the current one, used to spot names the concentrated money is rotating into or out of.
- Hedge-like filer
- A 13F filer classified as a hedge fund or concentrated-structural manager, either from a curated name list or inferred from its own book shape, and the only filer type counted toward crowding.
- Manager overlap
- The degree to which two funds hold the same set of tickers, used to map connections between institutional filers.
- Ownership-derived peer
- A ticker frequently held alongside another by the same crowd of funds, distinct from a sector or valuation-based peer group.
- Board interlock
- A link between two companies that share a director or officer, surfaced from Form 4 filer records rather than a full proxy-statement board roster.
Questions traders ask
What is a crowding score?
A 0-100 read on how concentrated hedge-like 13F filers are into a single name, blending how many funds hold it against how heavily they weight it in their own books. The most-crowded name that quarter is rebased to 100, so the score is relative to that quarter's peak, not an absolute measure. A ticker needs at least two qualifying holders before it ranks at all.
Which funds count toward crowding, and why are index funds excluded?
Only 'hedge-like' filers: dedicated hedge funds and other concentrated-structural managers, either identified from a curated name list or inferred structurally from the shape of their own book (how many positions they hold and how much sits in their top 10) when they're not on that list. Broad-market index ETFs are excluded entirely from every Capital Network computation, since a fund that owns the whole market by design tells you nothing about conviction.
What does "held alongside" mean, and how is it different from a peer group?
It's an ownership-derived relationship: which other tickers the same crowd of funds also holds, scored by how closely their holder bases overlap with a given ticker's. That's a different cut than a sector or valuation peer group, which groups by business similarity rather than by who actually owns it.
What are board interlocks, and why are so many companies missing from them?
An interlock is two companies sharing a person, a director or officer who shows up on both, surfaced from Form 4 filer data. Coverage is limited to people who've actually filed a Form 4 transaction, not a full board roster pulled from proxy statements, so a company where insiders haven't traded recently can show few or no interlocks even if its board overlaps exist in reality.
How is this different from the Institutions (13F) tab?
Institutions shows what individual funds bought and sold last quarter. Capital Network takes that same 13F data and derives a second layer on top: which names the concentrated money is crowded into together, how that crowding shifted quarter over quarter, and which people and tickers connect the filers to each other.
Every crowded name, one graph
14-day free trial. No credit card required.
20+ live channels · $10.50/mo billed annually