What institutions bought last quarter
Aggregate 13F activity across every filer, plus per-fund holdings trend.
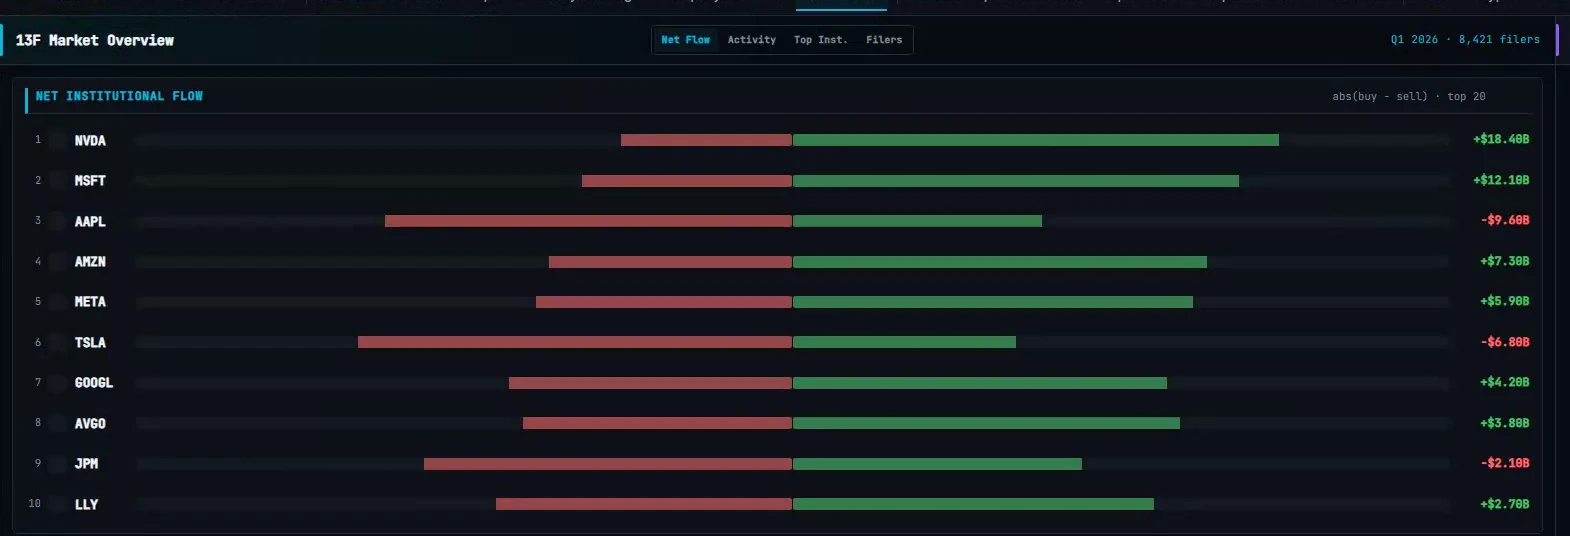 Real terminal UI · illustrative sample data
What is a 13F filing?
A 13F is a quarterly report the SEC requires from any institutional manager overseeing more than $100 million in securities. It lists most of their U.S. equity holdings as of the last day of the quarter, and managers get up to 45 days after quarter end to file it. That's not a trading update, it's a mandatory disclosure, and it applies to hedge funds, mutual funds, pension funds, and family offices alike: the whole population of large institutional capital, not a curated slice of it.
Compare one quarter's filing against the last and four things fall out of the difference: a new position (a stock the fund didn't hold last quarter but does now), a closed position (held last quarter, zero shares this quarter), and an increased or decreased position (the fund kept the stock but changed the size). A wave of new positions in the same name is generally read as the strongest signal in the data, since it's the clearest form of a fund choosing to step in.
data as-of
up to 45 days later
Same divider as the chart above, turned on its side. Everything left of it is what funds actually held. Everything right of it is how long the market waited to find out.
The full filer population, ranked and searchable
Not a shortlist of famous funds. The overview processes every 13F filer in the SEC EDGAR system for the current quarter and rolls the results up by ticker.
Most bought, most sold
Every quarter, every ticker gets ranked by net dollar value added or removed across the full 13F filer population, not a shortlist of well-known names. You see the same universe the SEC does, aggregated into one overview.
New, closed, and everything between
Each row breaks down how many funds opened a brand new position, added to an existing one, trimmed it, or exited entirely. A ticker with a wave of new positions reads very differently from one where funds are just topping up.
Search any fund, any quarter
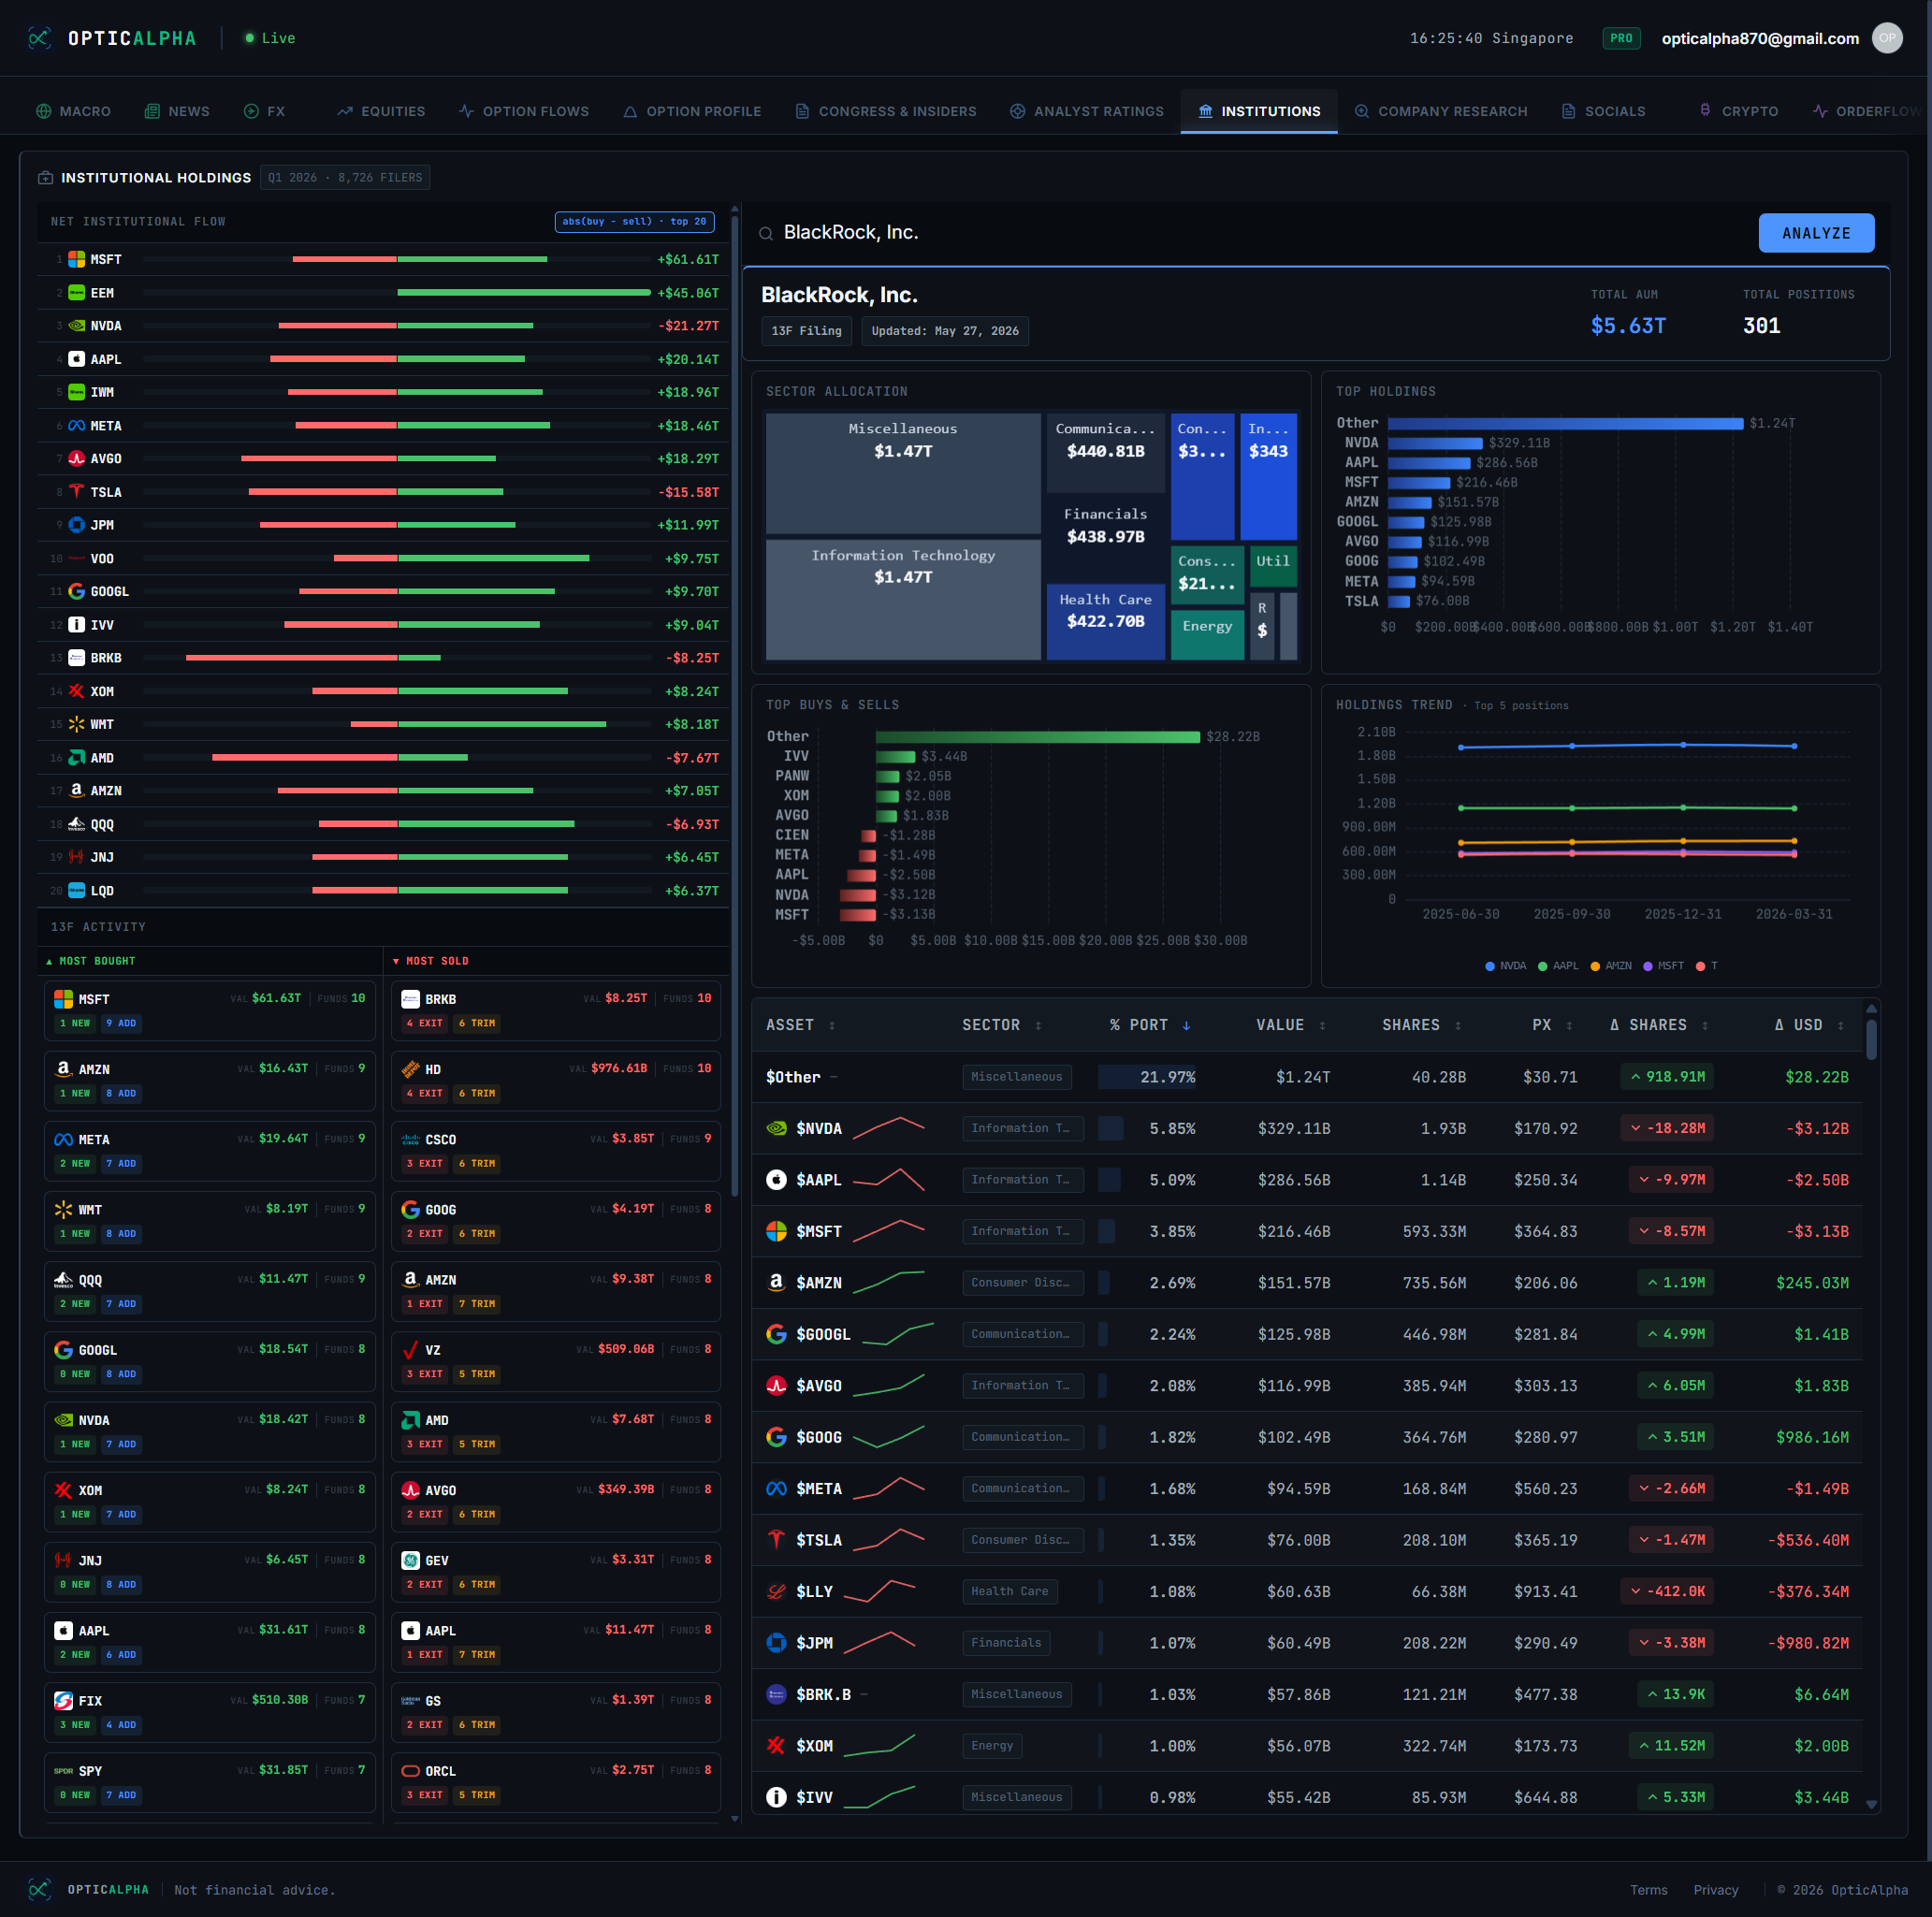
Look up a manager by name and see their holdings evolve over several quarters: what they added, what they cut, and how conviction in a single name has shifted filing over filing.
Top Institutions by AUM
A separate leaderboard ranking managers by total assets under management, a size-based cut of the same filer population rather than a buy/sell activity ranking. Select a fund and its most recent holding changes surface directly, without waiting on a full quarter-over-quarter comparison.
The overview, as it actually looks
Positioning, not a trade trigger
13F data is quarterly and it's always stale by the time you see it. The SEC gives managers 45 days after quarter end to file, so what you're looking at is a snapshot of where large funds stood six to seven weeks ago, not where they stand right now. That rules it out as a short-term trigger. What it's good for is spotting structural shifts: a sector a fund has been quietly building into over three or four straight quarters, or a name several unrelated managers all walked away from at the same time.
The signal that actually holds up is convergence. One fund opening a new position in a stock could be a hundred different reasons: a hedge, a basket trade, a mandate change. Several unrelated funds opening new positions in the same name in the same quarter is harder to explain away. It suggests independent research arrived at a similar conclusion, and that kind of agreement across managers who don't talk to each other is worth more than any single filing on its own.
None of this replaces price and volume. A 13F says nothing about entry price, current conviction, or whether a fund is still holding six weeks later. Treat it as one more input, a way of checking whether the structural story you're trading lines up with where the largest pools of capital were actually positioned, not a standalone reason to buy or sell.
Terms on this page
- 13F filing
- A quarterly SEC report disclosing most equity holdings of any institutional manager overseeing more than $100 million, due within 45 days of quarter end.
- New position
- A stock a fund did not hold last quarter but reported holding this quarter, the strongest form of institutional buying signal in 13F data.
- Closed position
- A stock a fund held last quarter but reported zero shares of this quarter, meaning they exited entirely.
- Increased / decreased position
- A fund added to or trimmed an existing holding without fully exiting or newly entering it.
- 45-day lag
- The reporting delay built into 13F rules. Data reflects where a fund stood at quarter end, not where it stands today.
- Institutional manager
- Any entity managing over $100 million in securities on behalf of others, the threshold that triggers the 13F filing requirement.
- Top Institutions leaderboard
- A ranking of institutional managers by total assets under management (AUM), a size-based cut of the institutional universe distinct from the buy/sell activity rankings elsewhere on the tab.
Questions traders ask
What is a 13F filing?
A 13F is a quarterly report that any institutional investment manager overseeing more than $100 million must file with the SEC, listing most of their equity holdings as of quarter end. It is filed within 45 days after the quarter closes.
Why is 13F data always a few weeks old?
The SEC gives managers a 45-day window after each quarter to file, so 13F data always shows positioning from roughly six to seven weeks earlier. That lag rules it out for short-term signals, but it is useful for spotting structural shifts in institutional positioning over time.
How does OpticAlpha calculate most bought and most sold?
The overview processes every 13F filer in the SEC EDGAR system for the current quarter and aggregates by ticker: total dollar value added or removed, how many funds opened a new position, how many increased, and how many closed out or trimmed. This runs against the full filer population, not a curated shortlist of well-known funds.
Can I search a specific fund's holdings?
Yes. Search by fund name to see that fund's per-ticker holdings across the last several quarters, so you can track whether their position in a stock has been growing, shrinking, or holding steady.
Does multiple funds buying the same stock mean anything?
When several unrelated institutions open new positions in the same name in the same quarter, it is generally read as a convergence signal, meaning independent analysis arrived at a similar conclusion. It does not guarantee the stock performs well, since 13F data says nothing about entry price or current conviction.
Is there a way to see institutions ranked by size rather than by activity?
Yes. The Top Institutions leaderboard ranks managers by total assets under management, a size-based cut of the same 13F filer population rather than a buy/sell activity ranking like Most Bought and Most Sold. Selecting a fund from the leaderboard also surfaces its most recent holding changes directly, so you can see what it added or trimmed without running a full quarter-over-quarter comparison yourself.
What does the Capital Network tab add on top of this?
Institutions shows you what individual funds bought and sold. Capital Network takes the same 13F data and derives a second layer: which stocks the concentrated money is crowded into together, how that crowding shifted quarter over quarter, and which tickers and people connect the filers to each other.
Related reading
Every quarter's filings, one overview
14-day free trial. No credit card required.
20+ live channels · $10.50/mo billed annually