Where leverage breaks first
A live map of the price levels that force liquidations across exchanges.
 Real terminal UI · illustrative sample data
What is a liquidation heatmap?
Every leveraged position on a crypto exchange has a price where the exchange closes it for the trader, whether they want out or not. That is a liquidation. Push enough accounts to the same edge, at similar entry prices and similar leverage, and you get a cluster: a price level where a lot of forced buying or selling is sitting there waiting to happen.
The heatmap plots those clusters on two axes. Price runs across the bottom, leverage tier runs up the side, from 5x up through 100x. The color of each cell shows how much leveraged exposure sits at that price and leverage combination. A quiet, dark cell means not much is stacked there. A bright cell means a lot of positions close together the moment price arrives, and each forced close adds pressure that can shove price into the next cluster over. That chain reaction is what traders call a cascade.
Three views of the same leverage
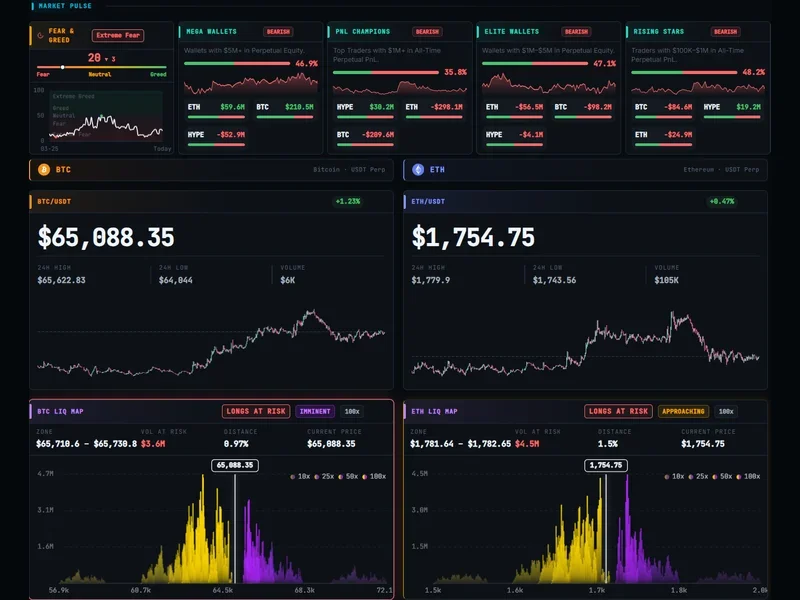
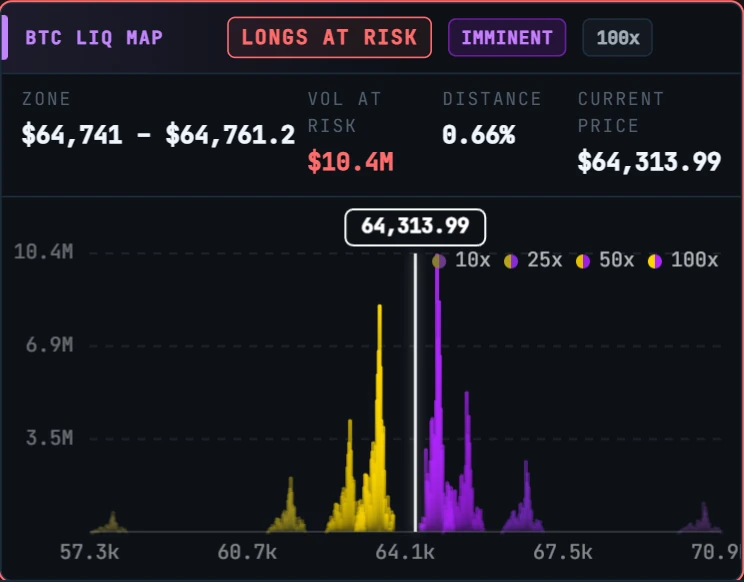
BTC & ETH liquidation heatmap
Price on one axis, leverage tier on the other, redrawn as new liquidation data arrives from the exchange feed. Built for the two names with deep enough leverage data across major exchanges to make the clusters mean something.
Live liquidation feed
Every forced close as it prints: symbol, side, size, price. Watch the feed during a fast move and you see a cascade unfold trade by trade instead of reading about it after it already happened.
Whale alerts, flagged live
Large perpetual futures trades as they open: trader address, coin, direction, size, entry price, leverage used. A run of whale-sized longs opening just under a resistance level is worth checking against the heatmap.
What the tab actually looks like
A target, not just a warning label
A liquidation cluster is not only a place where traders get hurt. It is a place price tends to go, because the close itself is forced and automatic. A heavy stack of 25x longs sitting below the market represents sell orders that fire the instant price trades down to their level, with no discretion involved on the trader's part. Market makers and algorithms know that in advance, so the level stops being just a risk zone and starts acting like a target.
That is the read most traders take from the map: find where the nearest heavy cluster sits relative to current price, and treat it as the level price is drawn toward, especially once a move is already headed that direction. A drop into a large long cluster tends to keep running until the cluster clears, then the forced selling that was fueling the move runs out and the drop tends to stall.
The heatmap shows where the pain is stacked before it happens. The live feed shows when it is actually happening. Watching both together, for example a burst of long liquidations printing on the feed right as price nears a heavy cluster on the map, is a much stronger read than either one on its own.
Terms on this page
- Liquidation
- The forced closing of a leveraged position by an exchange when a trader's margin can no longer cover their losses.
- Liquidation cascade
- A chain reaction where one price move triggers forced closes, and those closes push price further, triggering the next cluster.
- Leverage tier
- A grouping of positions by how much leverage was used to open them, such as 5x, 25x, or 100x. Higher tiers liquidate on smaller price moves.
- Long liquidation
- A forced sell that closes a leveraged long position, which happens when price falls to the trader's liquidation price.
- Short liquidation
- A forced buy that closes a leveraged short position, which happens when price rises to the trader's liquidation price.
- Whale alert
- A flagged large perpetual futures trade, shown with the trading address, size, direction, and leverage.
- Perpetual futures (perps)
- A futures contract with no expiry date, the dominant way traders take leveraged crypto positions on centralized exchanges.
Questions traders ask
What is a crypto liquidation heatmap?
It plots where leveraged long and short positions are concentrated across price and leverage tiers, from 5x up to 100x. When price reaches a heavy cluster, those positions get force-closed by the exchange, which itself pushes price further and can trigger the next cluster in a cascade.
Why do liquidation clusters act like a magnet for price?
A large cluster of over-leveraged positions represents forced buying or selling that will happen automatically once price gets there, independent of anyone's trading decision. Market makers and algorithms know this, so those levels often become short-term targets rather than just risk zones to avoid.
What counts as a whale alert?
Whale-sized perpetual futures prints and the wallet cohorts behind them now live on the Derivatives tab, tracked by direction, size, entry, and leverage across roughly 230 markets. This tab keeps its focus narrow: the heatmap and live liquidation feed, the forced-close side of the same leverage story.
How often does the liquidation data update?
The heatmap redraws as new liquidation data arrives from the exchange feed, and the live liquidation feed shows individual events (symbol, side, size, price) as they happen, so both stay current through fast-moving sessions.
Does this only cover Bitcoin?
The heatmap and live feed cover BTC and ETH, the two names with the deepest, most reliable leverage data across major exchanges. For positioning across the wider perp universe, funding rates, open interest, and whale wallets, see the Derivatives tab.
Related reading
Watch the leverage break
14-day free trial. No credit card required.
20+ live channels · $10.50/mo billed annually