Gamma exposure, mapped by strike
See where dealers have to hedge before price gets there.
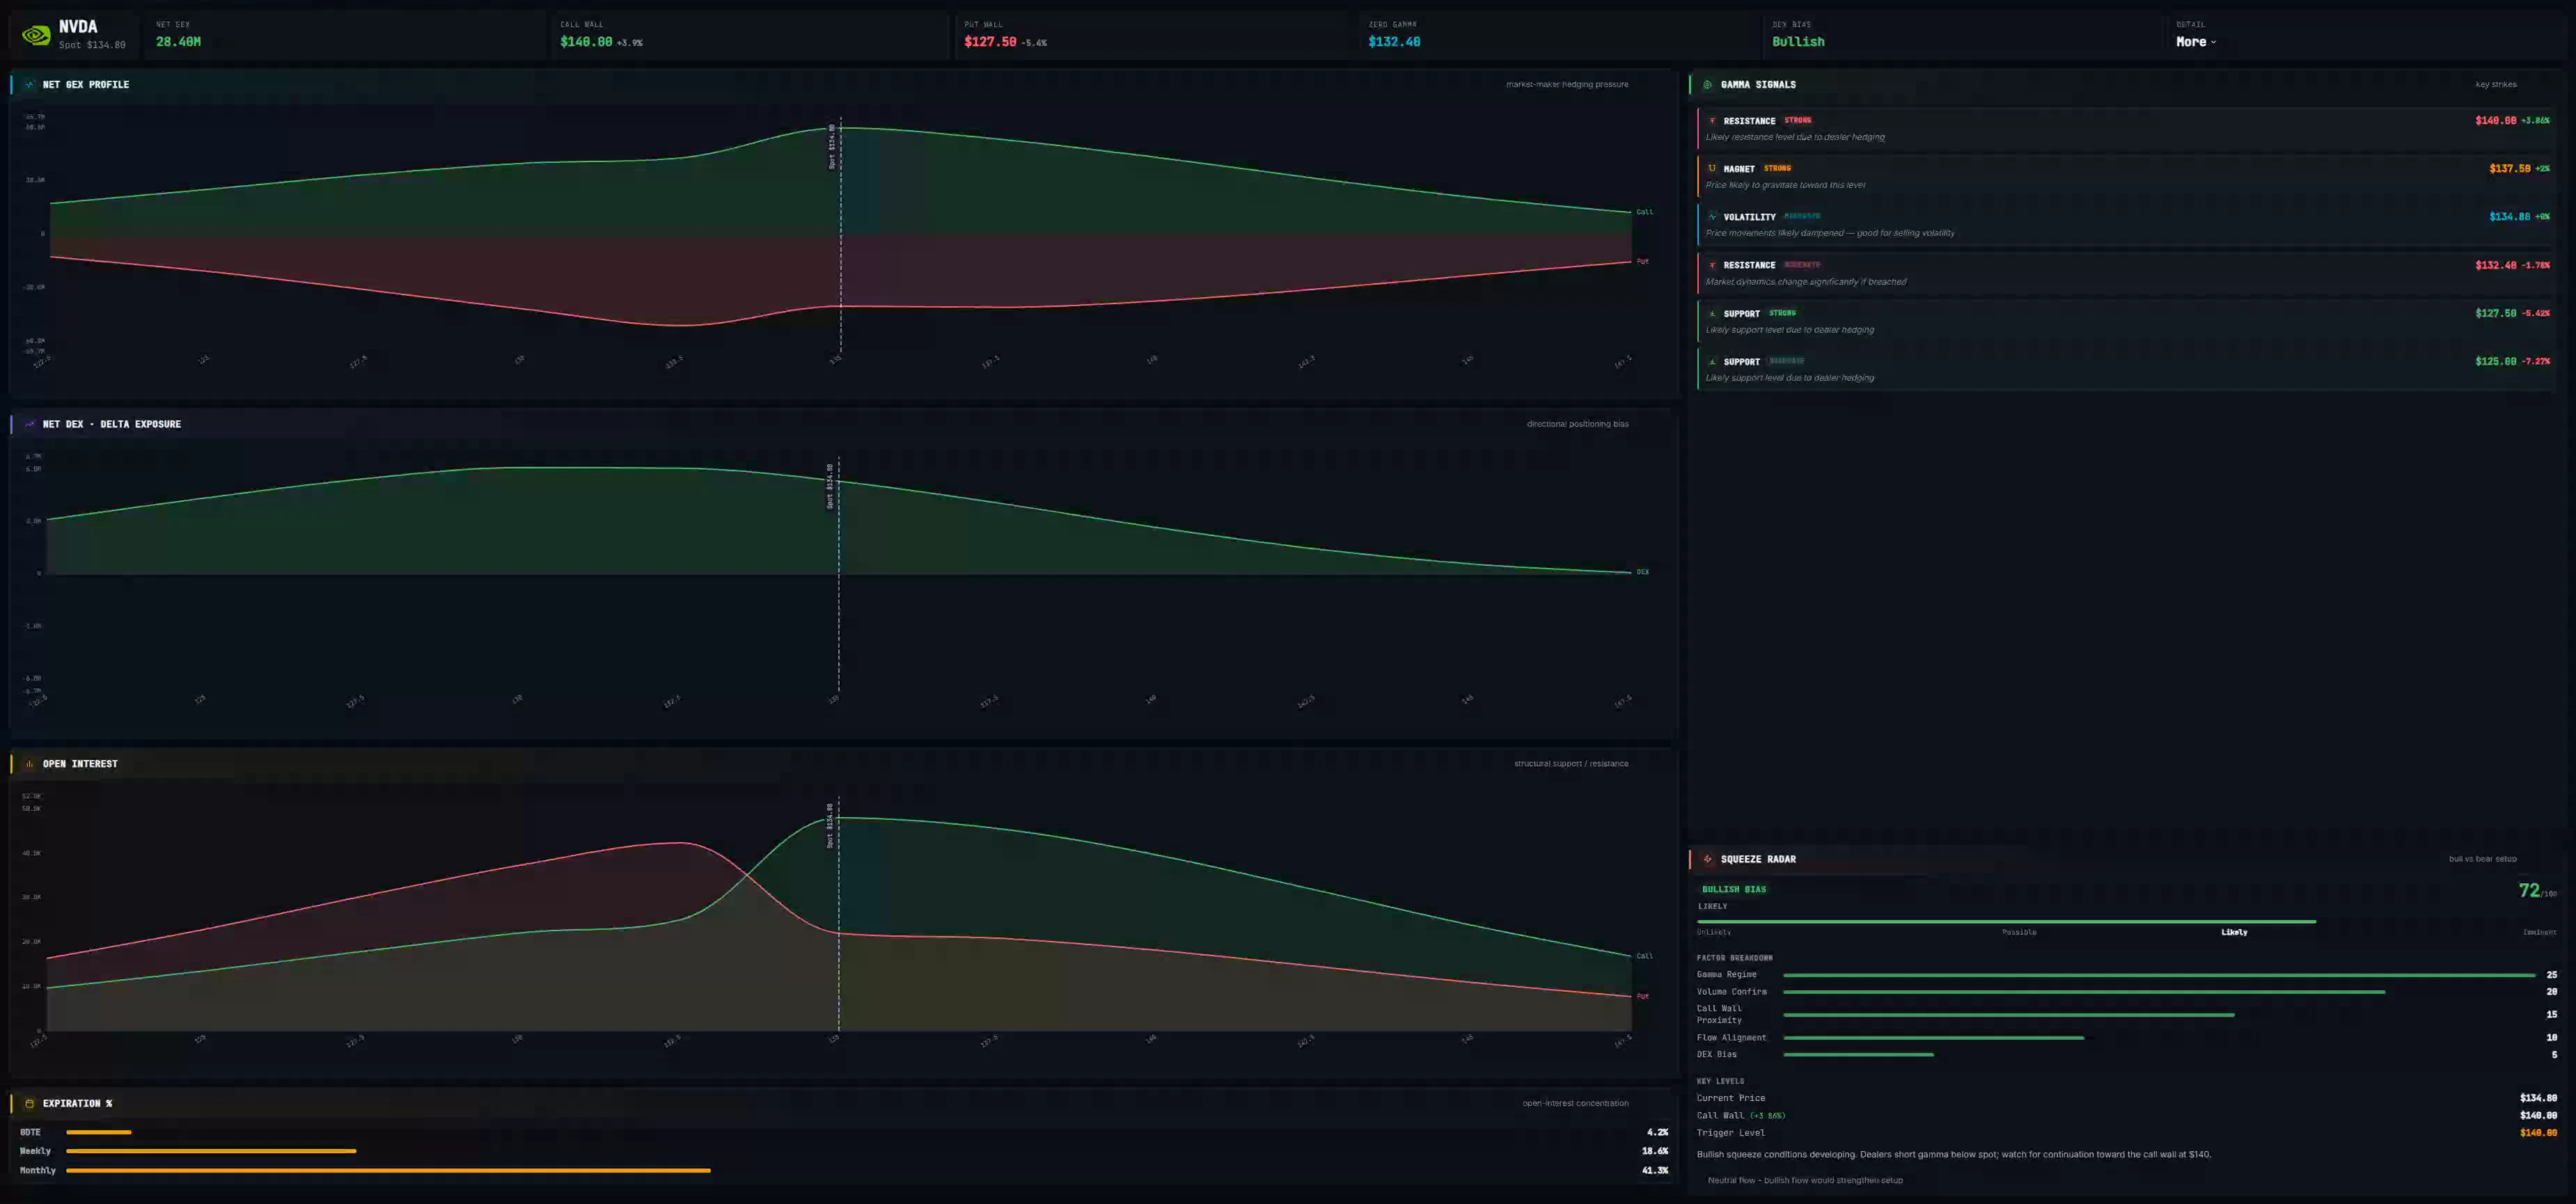 Real terminal UI · illustrative sample data
What is gamma exposure?
Every time someone trades an option, the dealer on the other side has to hedge it by trading the underlying stock. How much they buy or sell, and in which direction, depends on gamma: the rate at which an option's delta changes as price moves. GEX totals that hedging pressure across every strike in the chain, so you can see how much forced buying or selling flow dealers are sitting on at any given price.
The sign of that number matters more than its size. When dealers are net long gamma, they hedge by selling into rallies and buying into dips, which pins price down and keeps things calm. When they are net short gamma, they do the opposite: buying as price rises and selling as it falls, which pushes a move further than it would otherwise go.
The strike where net GEX crosses from positive to negative is the gamma flip line. It marks the boundary between those two hedging regimes, and it shifts every day as the options chain rolls and price moves.
What OpticAlpha shows
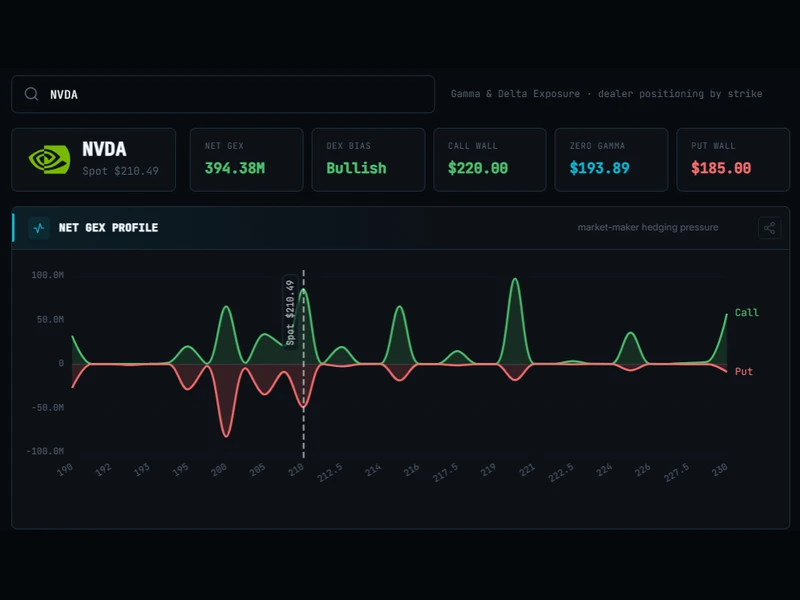
Net GEX by strike
A full profile across the chain for any ticker, built on demand from live options data. Most active names resolve in a few seconds.
Gamma walls
Strikes with an outsized GEX concentration stand out on the chart. Price tends to stall or reverse around them intraday, especially close to expiration.
Squeeze radar
A 0-100 score blending flow, positioning, and momentum, flagging tickers with the setup for a fast, forced move. See how it's calculated →
Delta exposure alongside GEX
DEX shows which way dealers are leaning by strike, so you can separate how much hedging they owe from which direction they're already positioned.
The profile, in the terminal
How traders use this
Check the zero line before you size anything. Above it, dealer hedging tends to keep things suppressed, so mean-reversion setups and tighter stops tend to hold up. Below it, the same setup can run further than you'd expect, because dealer flow is adding to the move instead of fighting it. That's the difference between a calm tape and an explosive one, and it's often decided by which side of the flip price is sitting on.
Gamma walls are the second thing to check. A strike carrying an outsized GEX concentration is where dealer hedging is heaviest, so price often slows down or reverses there intraday, more so as expiration gets closer. Where the nearest wall sits relative to spot is a rough map of where the day's chop is likely to happen.
Put the two together and GEX tells you where market maker hedging is creating support or resistance, not which way price is going next. It works alongside the flow feed and max pain rather than in place of them: flow tells you what's being bought right now, GEX tells you how dealers will react once price actually gets there.
Terms on this page
- Net GEX
- The sum of dealer gamma exposure across all strikes for a ticker. Positive means dealers are net long gamma overall; negative means net short.
- Gamma flip line
- The strike price where net GEX crosses from positive to negative. Marks the boundary between a hedging regime that dampens moves and one that amplifies them.
- Gamma wall
- A strike with an outsized GEX concentration. Acts as a magnet or a ceiling because dealer hedging flow is heaviest there.
- Positive gamma
- Dealers are net long gamma. They sell into rallies and buy into dips, which tends to pin price and lower realized volatility.
- Negative gamma
- Dealers are net short gamma. They buy into rallies and sell into dips, which tends to accelerate whatever direction price is already moving.
- Squeeze radar
- OpticAlpha's 0-100 score blending flow, positioning, and momentum to flag tickers with the setup for a fast, forced move.
- Delta exposure (DEX)
- Net directional exposure dealers hold by strike, shown alongside GEX to separate 'how much they must hedge' from 'which way they are leaning.'
Questions traders ask
What is gamma exposure (GEX)?
GEX measures how much delta hedging options dealers need to do as the underlying price moves through different strikes. When dealers are net long gamma, they buy as price falls and sell as price rises, which dampens moves. When they are net short gamma, they do the opposite, which amplifies moves. OpticAlpha calculates net GEX by strike for any ticker on demand.
What does the gamma flip line mean?
The gamma flip (or zero) line is the price level where dealer positioning switches from net long gamma to net short gamma. Above it, dealer hedging tends to suppress volatility. Below it, hedging tends to add fuel to a move. A lot of the tape you see during a sharp sell-off traces back to price crossing this line.
How is the squeeze radar score calculated?
The squeeze radar combines flow, positioning, and momentum into a single 0-100 score per ticker. A higher score means the setup has more of the ingredients that precede a fast, forced move, such as thin float, heavy short-dated call buying, or a dealer book that is short gamma into resistance. It is a screening tool, not a signal to trade blindly.
Is GEX data real time or delayed?
The GEX profile is generated on demand when you search a ticker, built from live options chain data. Most active tickers refresh in a few seconds. It is not a continuous stream like the options flow feed, since a full gamma profile needs the whole chain, not just the newest print.
Does OpticAlpha show gamma walls?
Yes. Strikes with unusually large GEX concentrations show up as walls on the chart. These are the levels where dealer hedging is heaviest, and price often stalls or reverses around them intraday, especially close to expiration.
Related reading
See live GEX profiles
14-day free trial. No credit card required.
20+ live channels · $10.50/mo billed annually