A plain-English regime read for Bitcoin and Ether
Nine drivers, each scored from negative to positive, combined into one verdict per coin, with the context behind it.
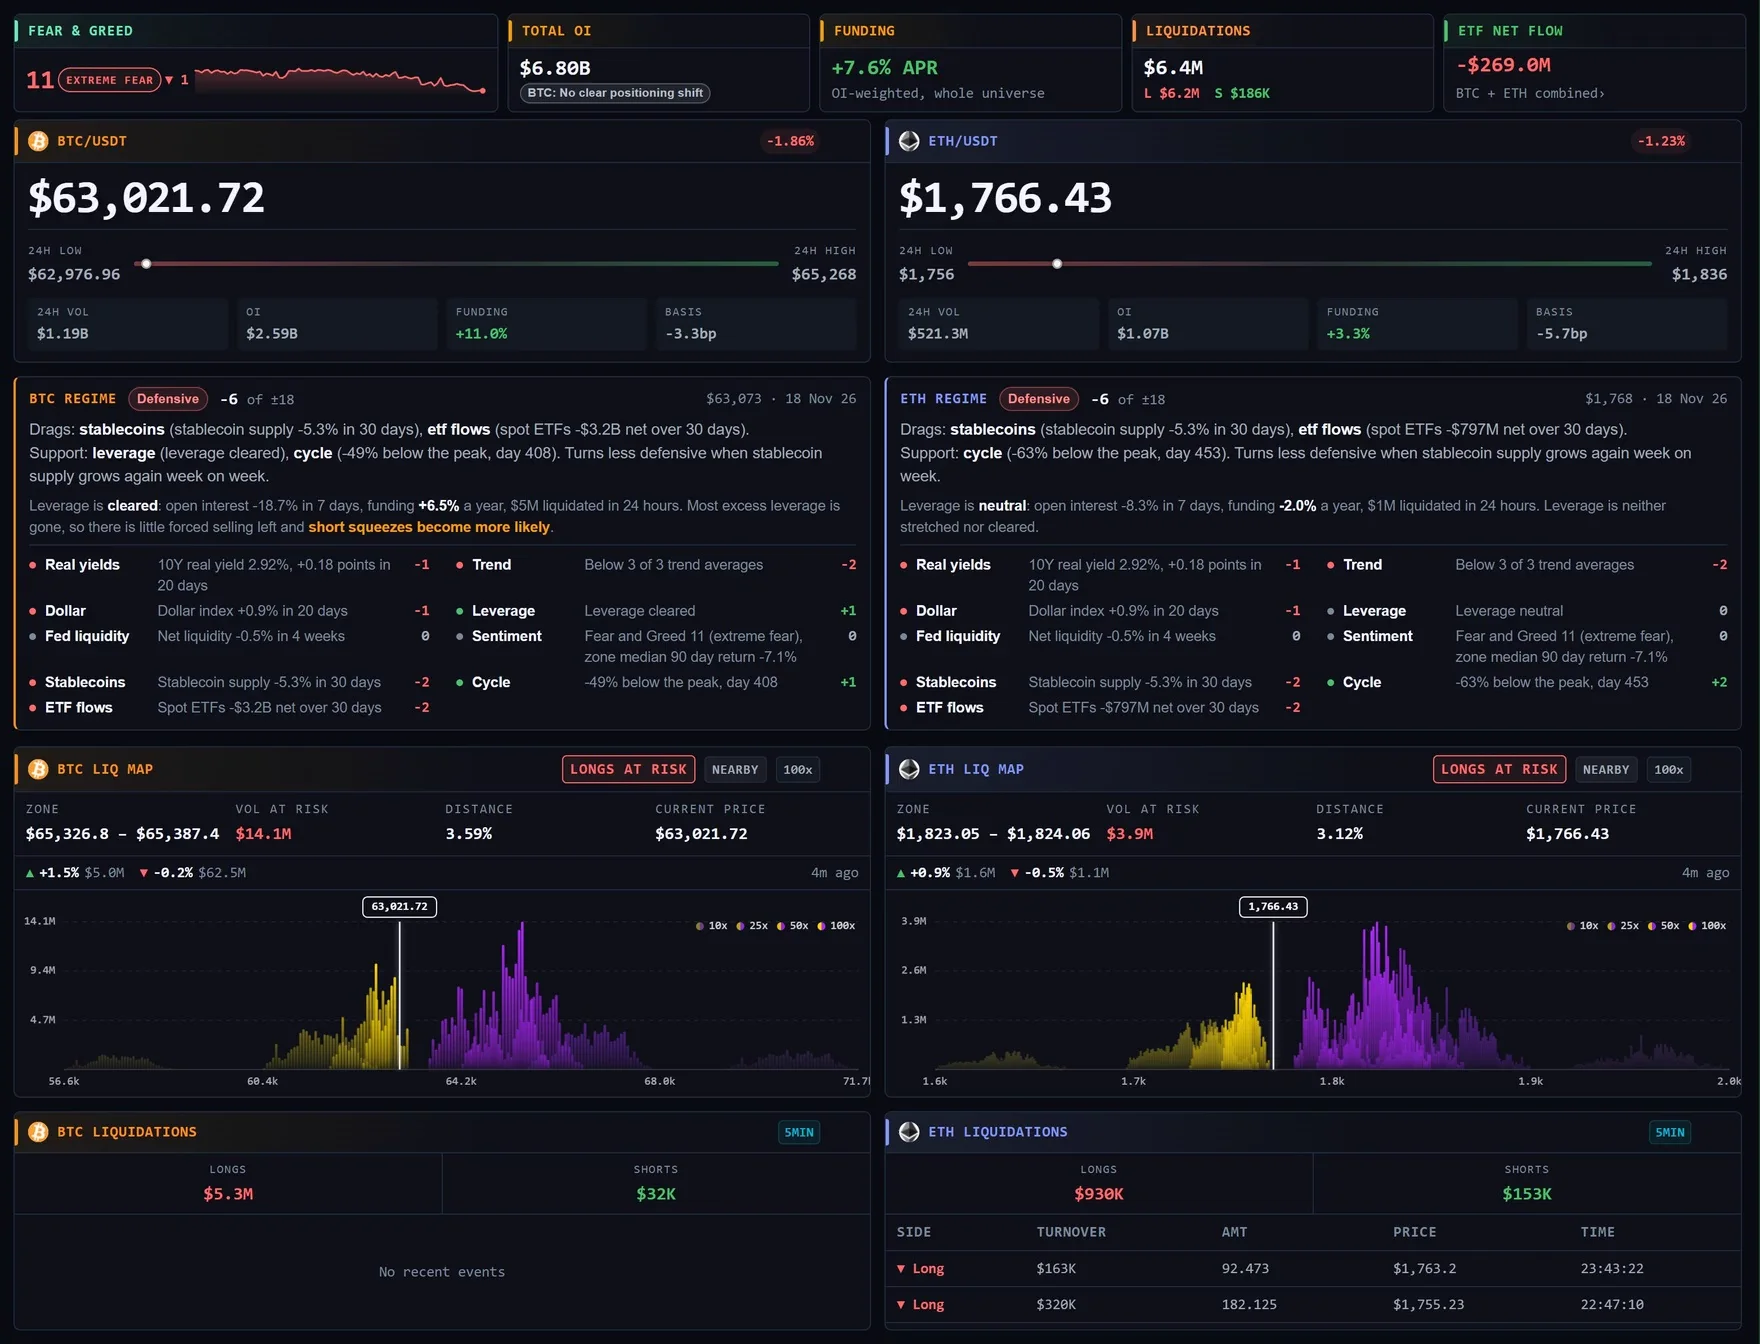
Recorded from the live terminal
A rule-based read on the backdrop for Bitcoin and Ether
The regime read answers one question for each coin: is the broader backdrop helping or working against it right now. Nine drivers cover the outside conditions (real yields, the dollar, Fed liquidity, stablecoin supply and spot ETF flows), the coin's own trend, how much leverage sits in the market, the fear and greed zone, and where the coin stands in its longer cycle. Each driver is scored from negative two to positive two using fixed rules, the nine scores are added together, and the total maps to one of five labels, from Constructive through Neutral to Defensive, with a leaning label on each side of Neutral.
Every verdict comes with a plain-English read shown as two lines: what is dragging the verdict down, and what is holding it up. The sentence is generated by the same rules as the score, so the words and the number always agree. Nothing is estimated by a model, and nothing is tuned by hand from one day to the next.
This is a rule-based read of current data. It is not a forecast, it does not state where price will go, and it is not financial advice. It tells you what the conditions look like today and which parts of the picture are carrying the read.
A verdict row, the drivers behind it, and the context around it
BTC and ETH Verdict Row
One verdict per coin: the label, the summed score, the plain-English sentence, a leverage line and the nine driver rows beneath. The two coins sit side by side so you can see whether the same backdrop is lifting or dragging both.
Nine Scored Drivers
Real yields, the dollar, Fed liquidity, stablecoin supply, spot ETF flows, trend, leverage, the fear and greed zone and the cycle. Each row shows its own short read in words and its score from negative two to positive two, so a single weak driver never hides inside an average.
Context View
The supporting panes behind the verdict: key price levels, how BTC and ETH correlate with equities, gold, the dollar, volatility and real yields, liquidity conditions, a one-year fear and greed chart with BTC, and ETH measured against BTC over time.
Derivatives and Orderflow Context
The leverage state from the verdict, with the liquidation maps on the Market view and funding and carry on the Perps Derivatives view, and the Orderflow Flow view that tests whether recent trades were large and one-sided enough to matter. These are the places to check whether the regime read is backed by positioning.
The Context view, close up
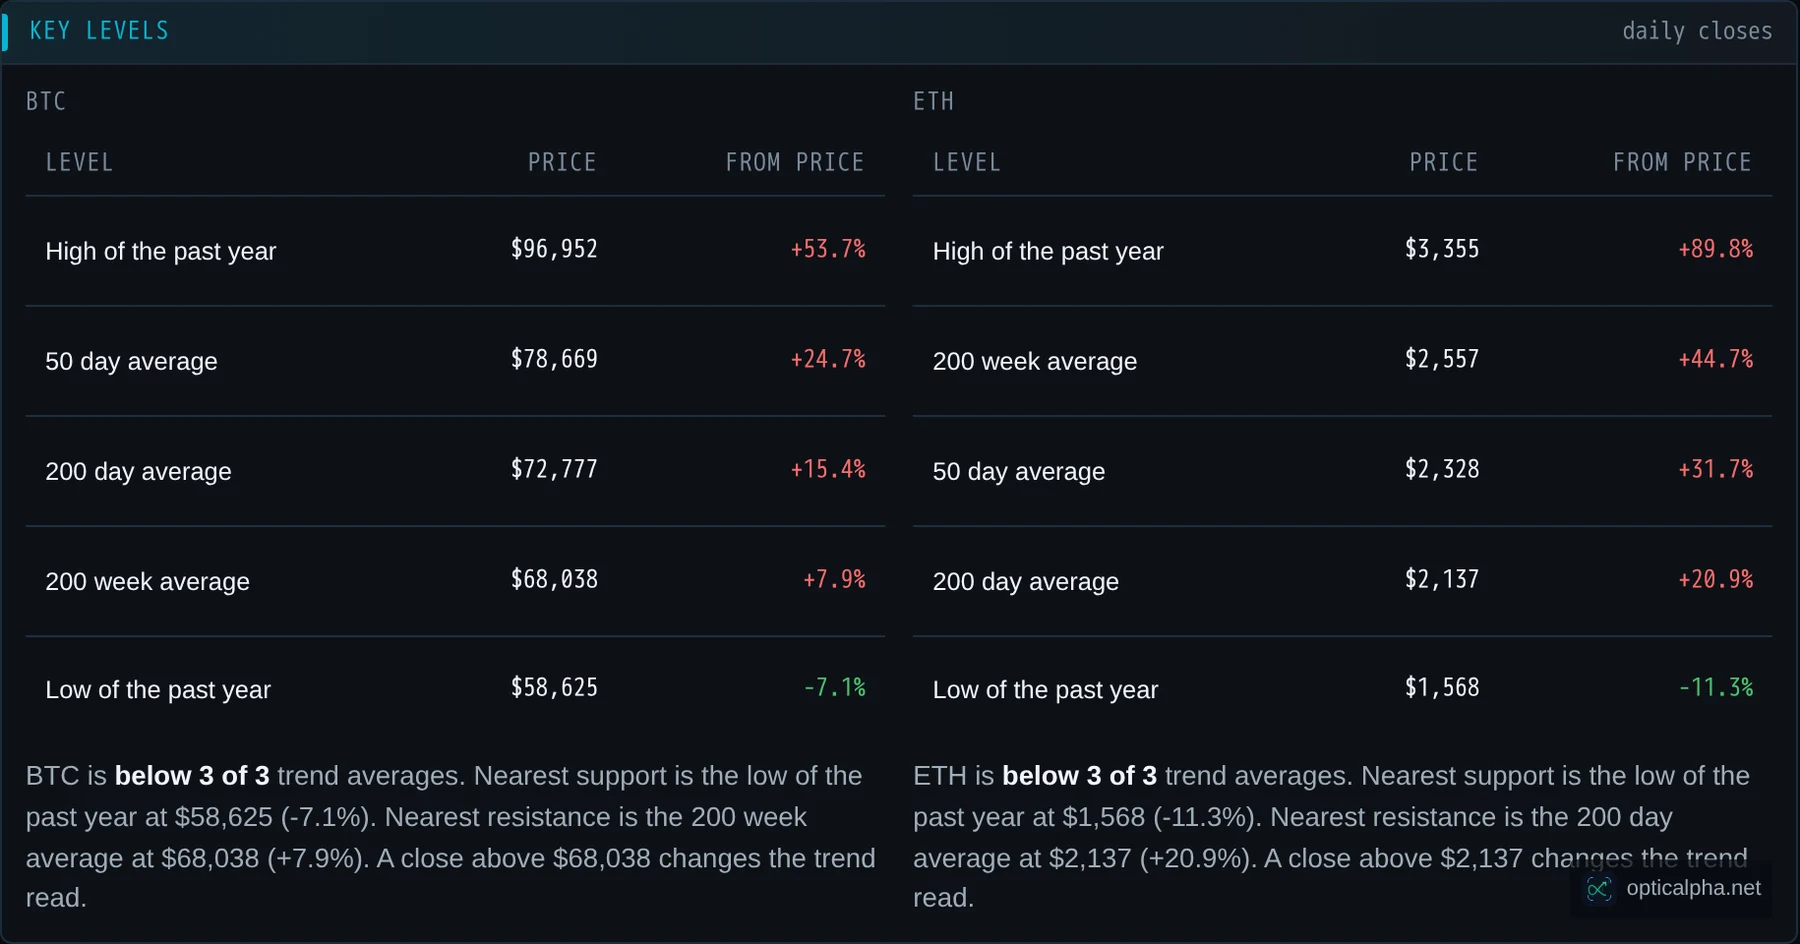
Start with the verdict, then check what is driving it
Read the label first, then the sentence, then the driver rows. If the verdict is Constructive but one driver is firmly negative, the sentence will say so, and that driver is the thing to watch. When BTC and ETH carry the same label, the backdrop is affecting both at once. When they differ, the driver rows show which inputs split them, the ETH versus BTC pane in Context shows the history, and the ETF Flows view shows the flow side.
Use the derivatives and orderflow views to check whether positioning agrees with the read. A Leaning verdict with a crowded leverage state is a different situation from the same label with leverage cleared. The regime read describes conditions; it does not replace your own analysis of entries, sizing or risk.
Terms on this page
- Regime
- A label summarising the broader backdrop for a coin, here one of Constructive, Leaning constructive, Neutral, Leaning defensive or Defensive, built from several scored drivers rather than one indicator.
- Real yield
- The 10-year Treasury yield after adjusting for inflation expectations. Higher real yields tend to weigh on assets with no cash flow, such as crypto.
- Fed net liquidity
- The Federal Reserve balance sheet adjusted for the Treasury cash account and reverse repo usage, a rough gauge of the dollar liquidity available to markets.
- Stablecoin supply
- The total value of dollar-pegged stablecoins in circulation. Growth in supply is often read as new money waiting to enter crypto markets.
- Spot ETF flows
- Net money moving into or out of exchange-traded funds that hold the coin directly. Sustained inflows or outflows show institutional demand or withdrawal.
- Leverage state
- A label for how much borrowed exposure sits in the market, cleared, building, neutral or crowded, read from funding, the recent change in open interest and recent liquidations.
- Drawdown cycle
- How far the coin trades below its prior peak, used as a rough read on where the market sits in its longer cycle.
Questions traders ask
A rule-based summary of the backdrop for Bitcoin and Ether. Nine drivers are each scored from negative two to positive two using fixed rules, the scores are added, and the total maps to one of five labels, from Constructive through Neutral to Defensive, with a leaning label on each side of Neutral. It describes conditions today, it does not predict prices.
Real yields, the broad dollar, Fed net liquidity, stablecoin supply, spot ETF flows, trend against long moving averages, leverage state, the fear and greed zone, and the cycle position measured from the prior peak. Each driver shows its own short read next to its score.
No. The read contains no probabilities, price targets or buy and sell calls. It tells you what the current data says about the backdrop and which drivers are carrying the read. It is not financial advice, and it should be checked against your own research.
The sentence is shown as two lines: what is dragging the read down, and what is holding it up. It is generated by the same rules as the score, so the words and the total always agree, and you can see which driver to watch rather than a single number.
Key price levels, how BTC and ETH correlate with equities, gold, the dollar, volatility and real yields, Fed net liquidity and stablecoin supply, a one-year Fear and Greed chart with BTC, and ETH measured against BTC, liquidity conditions, the fear and greed history, and ETH measured against BTC over time. It is the supporting detail behind the verdict row.
It is recalculated on a scheduled cycle from the latest available data for each driver. Some inputs update daily, so the read reflects the most recent completed data rather than a live tick.
See where the backdrop stands
14-day free trial. No credit card required.
17 live tabs · $10.50/mo billed annually