Where crypto leverage is actually positioned
Funding, open interest and basis across the perp universe, plus the wallets and treasuries behind it.
Funding, positioning, and the wallets and treasuries behind it
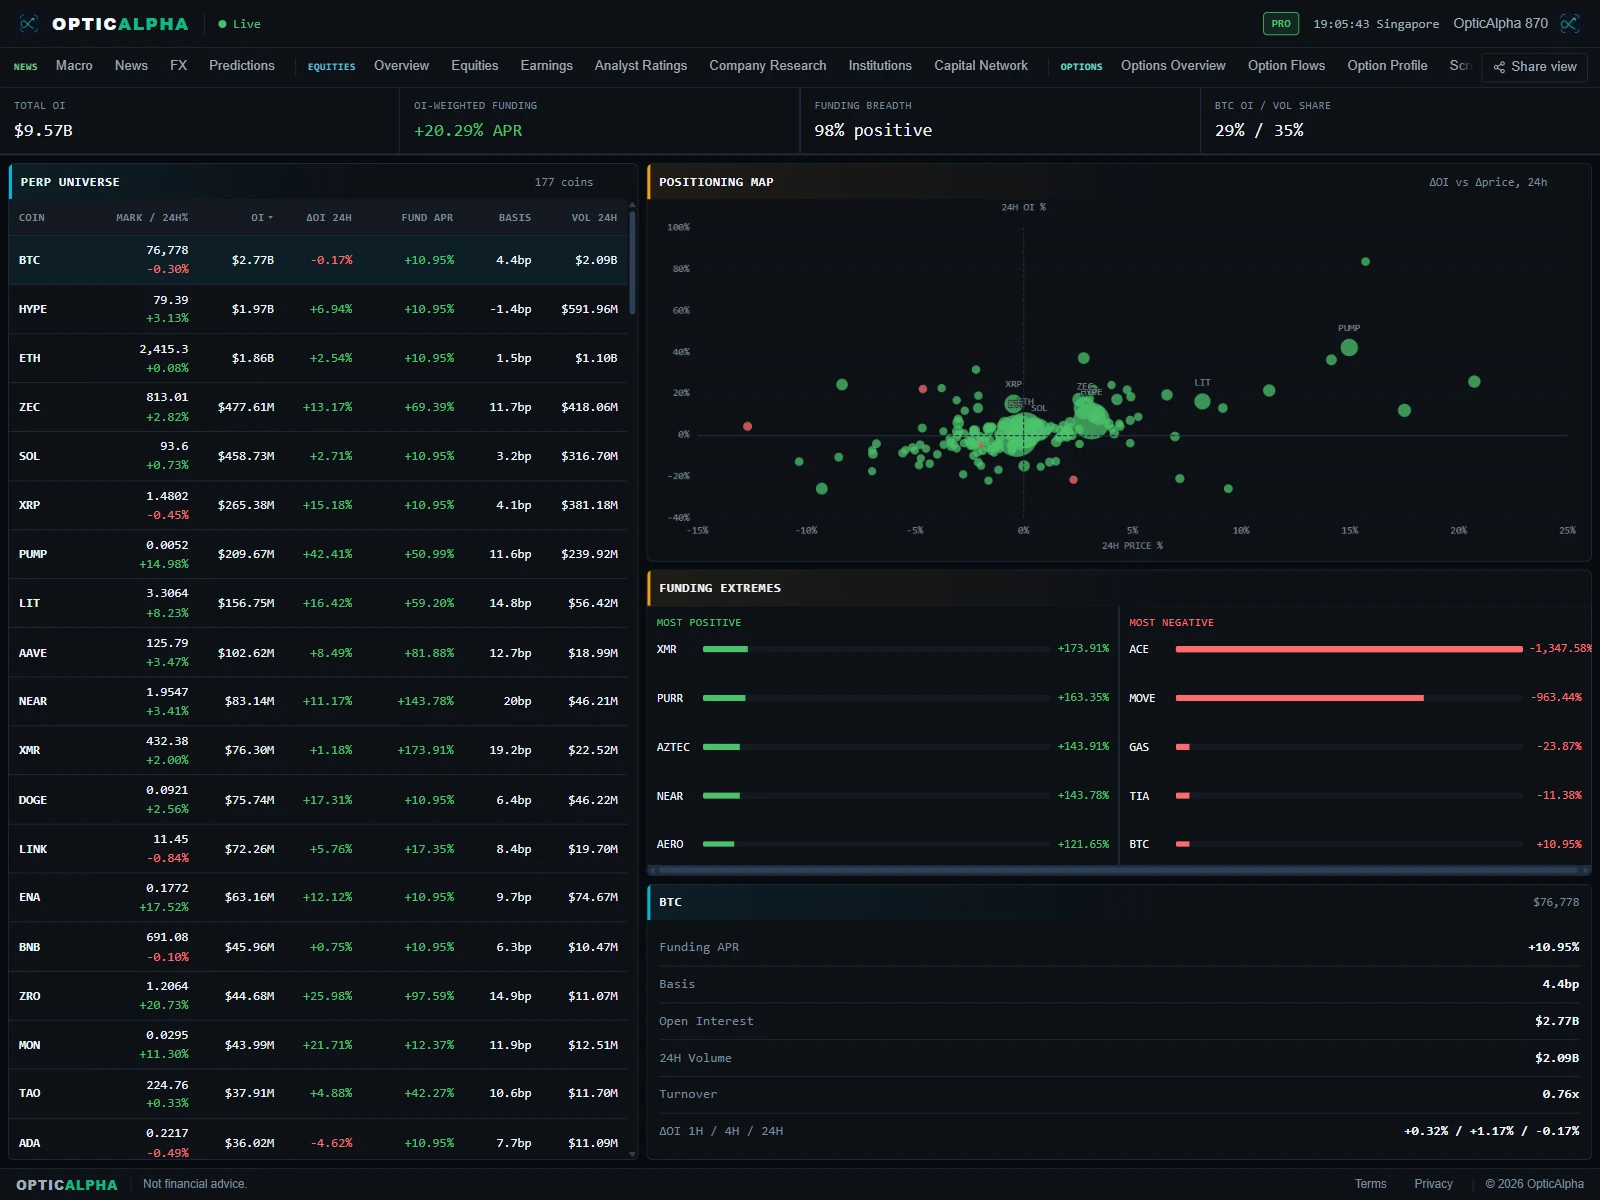
Derivatives is a sortable table of roughly 230 perpetual futures markets: mark price, 24-hour percent change, open interest, the 24-hour change in open interest, funding APR, basis against spot, and volume, all on one screen instead of spread across a dozen exchange tabs. A row of aggregate tiles sits above it, total open interest across the whole universe, an OI-weighted funding number, the share of markets currently paying positive versus negative funding, and Bitcoin's own share of total OI and volume, so you get the market-wide read before you ever sort a single column. The positioning map plots each coin's 24-hour ΔOI against its 24-hour Δprice, turning that same table into a four-quadrant scatter where the names building or unwinding leverage fastest show up as outliers instead of getting buried in a ranked list.
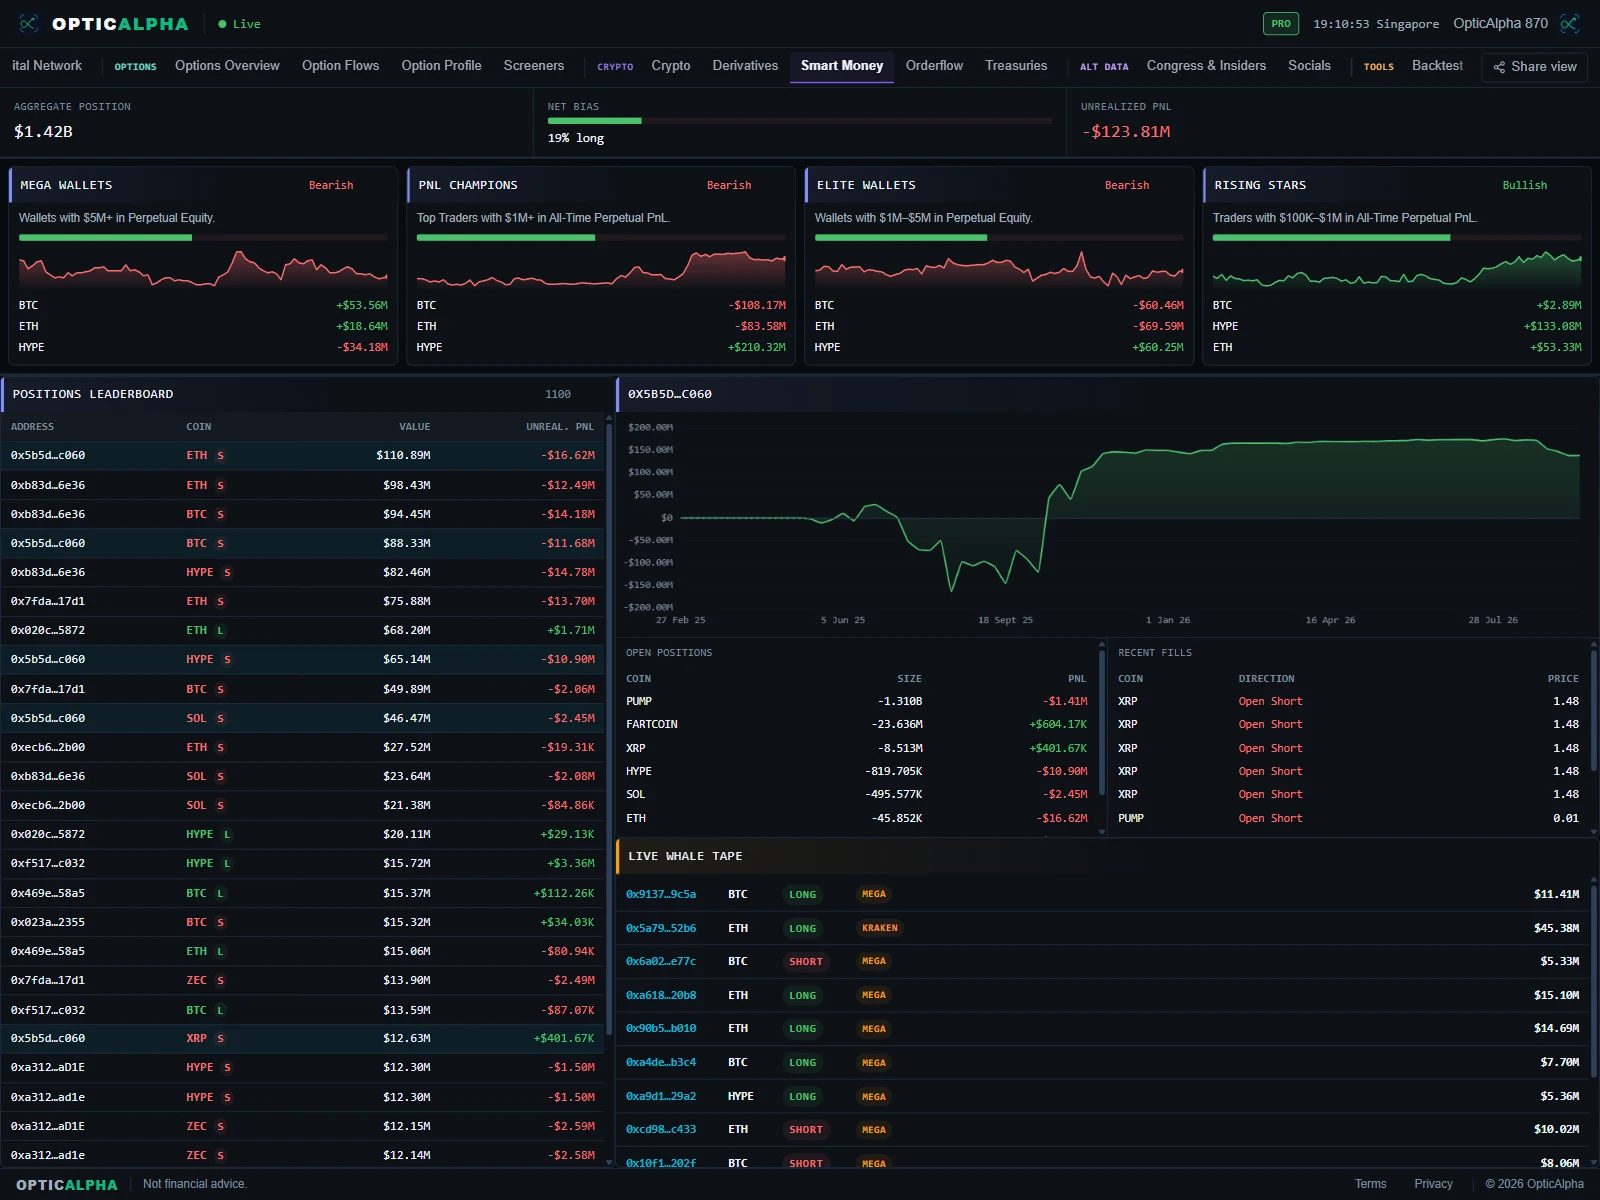
Smart Money tracks four whale-wallet cohorts, Mega Wallets, PnL Champions, Elite Wallets, and Rising Stars, each with its own net long or short bias tracked separately from the others. A live whale trade tape runs alongside them, printing large perpetual futures trades as they open so you can watch a cohort's stated bias turn into actual positioning in real time.
Treasuries covers corporate and entity holders of bitcoin and ether directly: how much each one holds, the current USD value of that holding, and mNAV, the market cap of the holding company divided by what its coins are actually worth. Per-entity accumulation history shows whether a company has been adding, holding flat, or trimming its position over time.
Three tabs, one leverage picture
Perp Universe & Funding
Roughly 230 perpetual futures markets, sortable by mark price, 24h%, open interest, ΔOI 24h, funding APR, basis, and volume, plus aggregate tiles for total OI, OI-weighted funding, funding breadth, and BTC's OI/volume share.
Positioning Map
A four-quadrant scatter of ΔOI against Δprice over 24 hours, surfacing the coins building or unwinding leveraged positions fastest instead of leaving them buried in a sorted table.
Whale-Wallet Cohorts
Mega Wallets, PnL Champions, Elite Wallets, and Rising Stars, each tracked for its own net long or short bias, with a live whale trade tape showing large positions as they open.
Treasury Holdings & mNAV
Corporate and entity BTC and ETH holdings: total coins held, total USD value, mNAV, and a per-entity accumulation history showing whether a holder is adding or trimming.
What the tabs actually look like
Crowding, outliers, and cross-checks
Funding extremes are the fastest read. A funding APR pushed well above the rest of the universe means longs are paying a premium to stay positioned, a sign the trade is crowded and more exposed to a squeeze the other way if price stalls. The positioning map does the same job visually: a coin sitting far out in a corner, building both OI and price fast, is telling you leverage is piling in before that shows up as an obvious move on a plain price chart. That's the point of plotting ΔOI against Δprice instead of ranking one column at a time, the outliers announce themselves.
Whale cohort bias works as a cross-check rather than a signal on its own. If Mega Wallets and Elite Wallets are leaning short while retail sentiment elsewhere is loudly bullish, that gap is worth noting before sizing a position around the crowd. mNAV plays the same role for treasury stocks: a company trading at a wide premium to what its coins are worth is pricing in continued accumulation, and a company trading at a discount is being valued below its own balance sheet, either of which changes whether the stock or the coin itself is the better way to express the same view.
Terms on this page
- Funding rate
- The periodic payment between long and short perpetual futures holders that keeps the perp price anchored to spot, shown annualized as an APR.
- Open interest (perpetual futures)
- The total value of contracts still open in a perp market, distinct from volume, which counts trades over a period rather than positions currently outstanding.
- Basis
- The price gap between a perpetual futures contract and the underlying spot price, reflecting how much leverage demand is pushing the perp away from spot.
- Funding breadth
- The share of the perp universe currently paying positive versus negative funding, used to gauge whether leverage is broadly leaning long or short market-wide.
- Positioning map
- A scatter of each coin's 24-hour open interest change against its price change, used to spot the names building or unwinding leverage fastest.
- Whale cohort
- A wallet-tier bucket (Mega Wallets, PnL Champions, Elite Wallets, Rising Stars) tracked for its own net long or short bias and history, sourced from wallet activity data.
- mNAV
- A crypto treasury company's market cap divided by the USD value of its crypto holdings, showing the premium or discount the market assigns above or below the raw holdings value.
Questions traders ask
What is a funding rate, and what does a positive funding APR mean?
A periodic payment exchanged between long and short holders of a perpetual futures contract, designed to keep the perp's price anchored to spot. OpticAlpha shows it annualized as a funding APR. Positive funding means longs are paying shorts, which signals the crowd is net long and leaning bullish; negative funding flips that, with shorts paying longs.
What does a rise in open interest tell you that price alone doesn't?
Open interest is the total value of contracts still open, a different measure than volume, which just counts trades. Rising OI alongside rising price means fresh money is entering new longs; rising OI alongside falling price means fresh shorts are being opened. Falling OI in either direction means positions are closing, not opening, which changes how much you should trust the move continuing.
How do you read the positioning map (ΔOI against Δprice)?
It's a four-quadrant scatter plotting each coin's 24-hour change in open interest against its 24-hour price change, so the coins building or unwinding leveraged positions fastest stand out as outliers rather than getting buried in a ranked list.
What are the whale cohorts, and where does the wallet data come from?
Four wallet-tier buckets, Mega Wallets, PnL Champions, Elite Wallets, and Rising Stars, each tracked for its own net long or short bias and positioning history, built from wallet activity data rather than a single trader's feed.
What is mNAV, and why does it matter for a company holding bitcoin?
A treasury company's market cap divided by the USD value of the crypto it holds. An mNAV above 1 means the market is paying a premium over the raw holdings value, usually on the expectation of further accumulation; below 1 means the stock trades at a discount to what its coins are actually worth.
See where the leverage sits
14-day free trial. No credit card required.
20+ live channels · $10.50/mo billed annually