What moved today, and why, ranked
A ranked Hot List, session-aware movers, unusual volume, and a multi-source conviction score, in one tab.
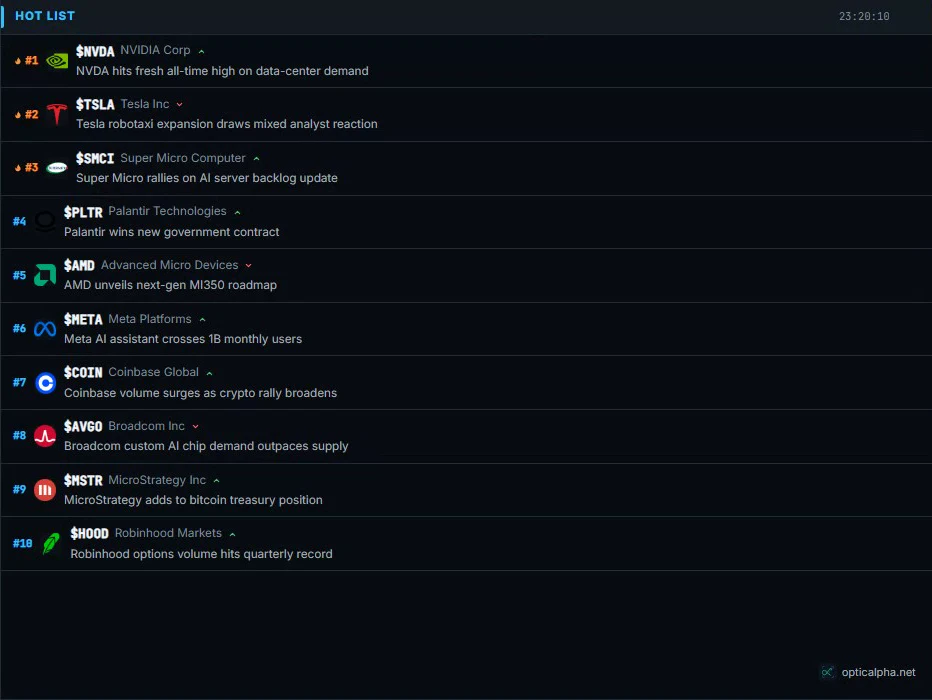 Real terminal UI · illustrative sample data
What is the Equities tab?
The Equities tab leads with the Hot List: a ranked leaderboard of whatever is generating the most trading and search activity right now, each row paired with the headline actually behind the move. It isn't just a volume sort. The ranking blends trade activity, search interest, and news attention into one heat score, so a name can surface before its price or volume alone would explain why.
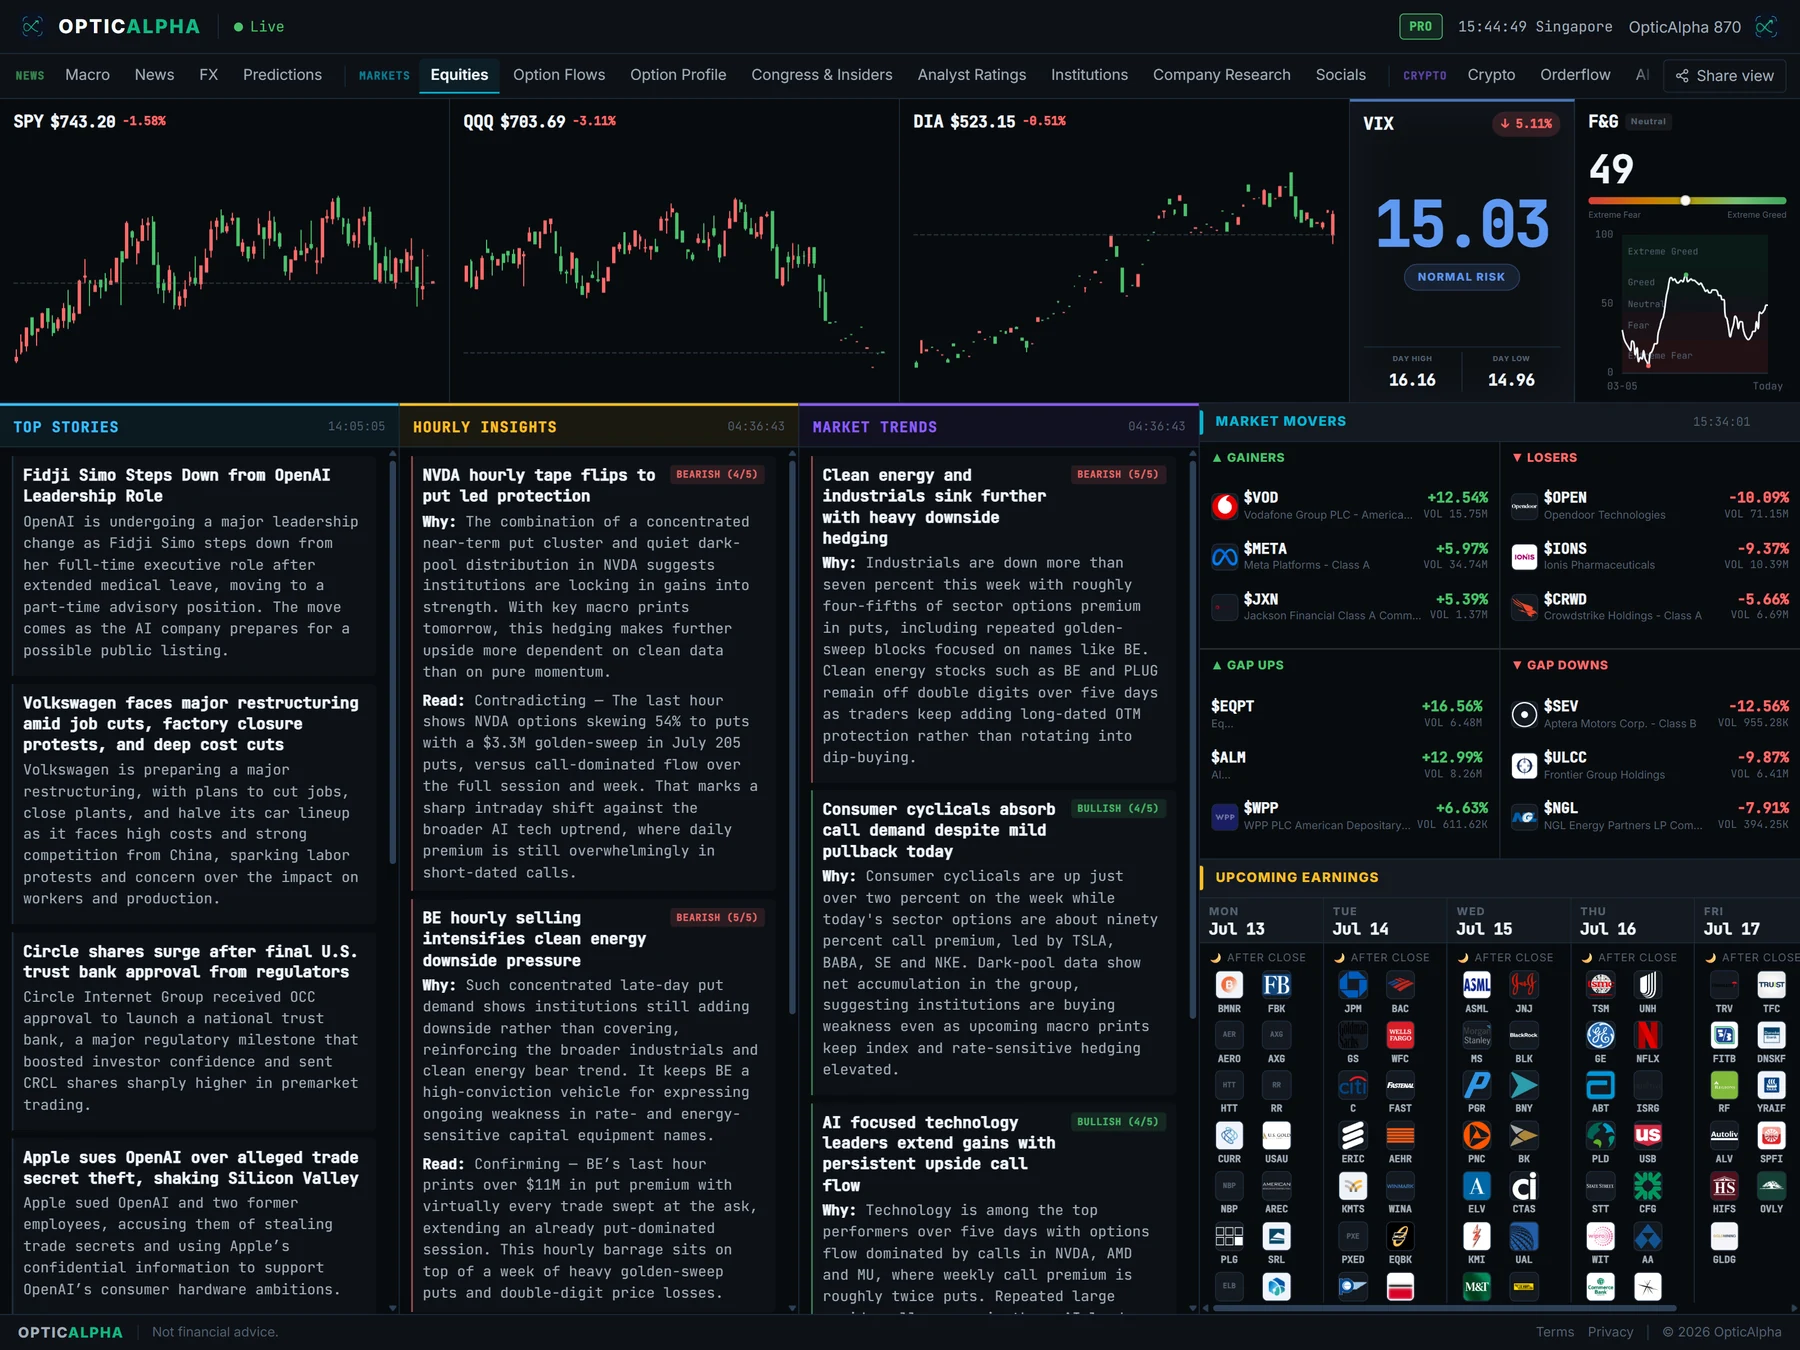
Below that, Market Movers splits into Gainers and Losers, with a session toggle for regular hours, pre-market, post-market, and overnight, plus a Gaps view for names opening well away from their prior close. Unusual Volume sits alongside it, re-ranking that same pool by how far today's volume runs above a stock's own normal average rather than by price change, so a quiet mover trading several times its usual size still gets flagged.
The right column runs Conviction Radar, Upcoming Earnings, and an IPO Calendar. Conviction Radar casts a directional vote per ticker from six independent sources and only surfaces a name once at least two agree, so it reads as a convergence signal rather than a single loud one.
What OpticAlpha shows
Hot List
A ranked heat score blending trade activity, search interest, and news attention, with the driving headline shown right on the row.
Session-aware movers
Gainers, Losers, and Gaps, switchable across regular hours, pre-market, post-market, and overnight sessions, so you see who is moving whenever you're actually looking.
Unusual Volume
The same movers pool, re-ranked by volume relative to each stock's own normal average instead of by price change, surfacing quiet-price, heavy-volume setups.
Conviction Radar
A six-source convergence score: flow, social, congress, insider, analyst, and Hot List heat. A ticker needs at least two aligned to surface at all.
The full tab, as it actually looks
How traders use this
Most traders start with the Hot List rather than a raw gainers list, since it answers "what's actually happening" instead of just "what moved." A name climbing the heat score before its price has caught up is often still early. Unusual Volume works the same angle from the other direction: a stock trading three or four times its normal volume with barely any price change yet is frequently the setup, not the aftermath.
The session toggle matters more than it looks. A gap up on the pre-market list can fully fade by the open, and a name that barely moved during regular hours can be the loudest mover overnight on international news. Checking more than just the regular-hours view catches moves before the bell instead of after.
Conviction Radar is built for the moment you want more than one data point agreeing before acting. A ticker with unusual options flow alone is one signal. The same ticker also showing rising social attention and a recent insider buy is a different conversation, and the tier shown, Emerging through Extreme, tracks exactly how many of the six sources actually line up. See how it's calculated →
Terms on this page
- Hot List / heat score
- A composite ranking of trade activity, search interest, and news attention for a ticker. A relative 'how hot right now' measure, not a price or dollar-volume figure.
- Unusual volume
- A stock trading at an outsized multiple of its own normal average volume, independent of how much its price actually moved.
- Session (Reg / Pre / Post / O/N)
- The trading window a mover list is scoped to: Regular hours, Pre-market, Post-market (After Hours), or Overnight.
- Conviction Radar / aligned sources
- OpticAlpha's cross-source signal: a ticker surfaces only once at least two of six independent sources (flow, social, congress, insider, analyst, hot list) point the same direction.
- IV Rank chip
- Flags an earnings name whose current implied volatility sits high relative to its own history, a sign options are pricing in a larger-than-usual move for that report.
Questions traders ask
What is the Hot List and how is it ranked?
A ranked leaderboard of the tickers generating the most trading and search activity right now, each row paired with the headline actually driving it. It isn't just a volume sort, it's a composite heat score combining trade activity, search interest, and news attention, so a stock can rank highly on attention alone even before its volume catches up.
How does the Unusual Volume panel differ from Gainers and Losers?
Gainers and Losers rank by price move. Unusual Volume re-ranks that same pool by how far today's volume runs above a stock's own normal average, so a name barely moving in price but trading several times its typical volume still surfaces, since that quiet-price-heavy-volume combination often precedes a move rather than following one.
What does the session toggle on Market Movers do?
Switches the gainers and losers list between regular hours, pre-market, post-market, and overnight sessions, so you can see who is actually moving right now instead of only during the 9:30-4:00 window.
What is the Conviction Radar scoring?
It casts a directional vote per ticker from six independent sources: options flow, social attention, congressional trades, insider trades, analyst rating changes, and Hot List heat. A ticker needs at least two of those sources aligned in the same direction to surface at all, and the tier shown (Emerging, Moderate, Strong, Extreme) reflects how many independently agree, not a single source shouting loudest.
How current is the earnings calendar and IPO list?
Earnings shows each ticker's EPS estimate, prior actual, and whether the report lands before the open or after the close, with a high-IV-rank flag on names where options are pricing in an outsized move. The IPO calendar lists upcoming listings with their expected price range and date.
Related reading
See what's actually moving, ranked
14-day free trial. No credit card required.
20+ live channels · $10.50/mo billed annually