Seven pairs, one page, no delay
Live spot rates, COT positioning, and central bank rates for the majors.
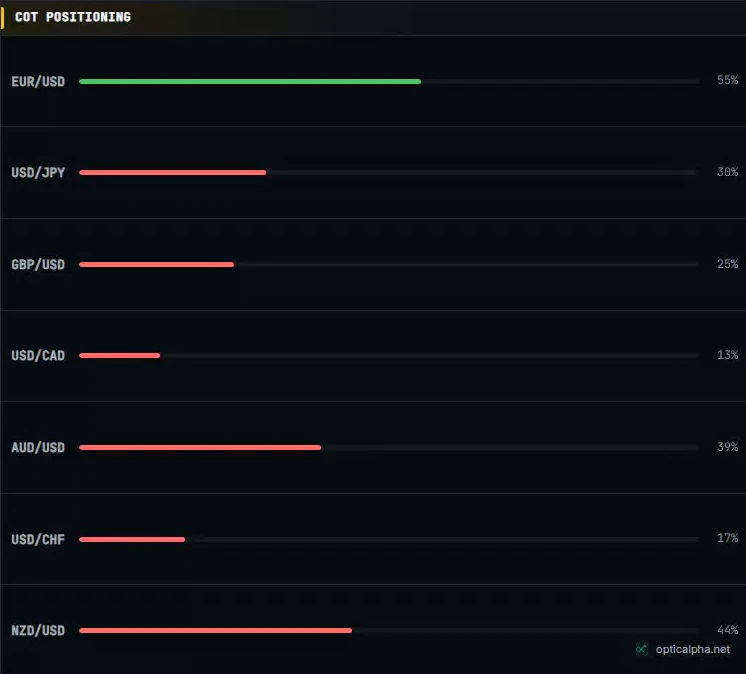
Real terminal UI · illustrative sample data
What is forex trading on OpticAlpha?
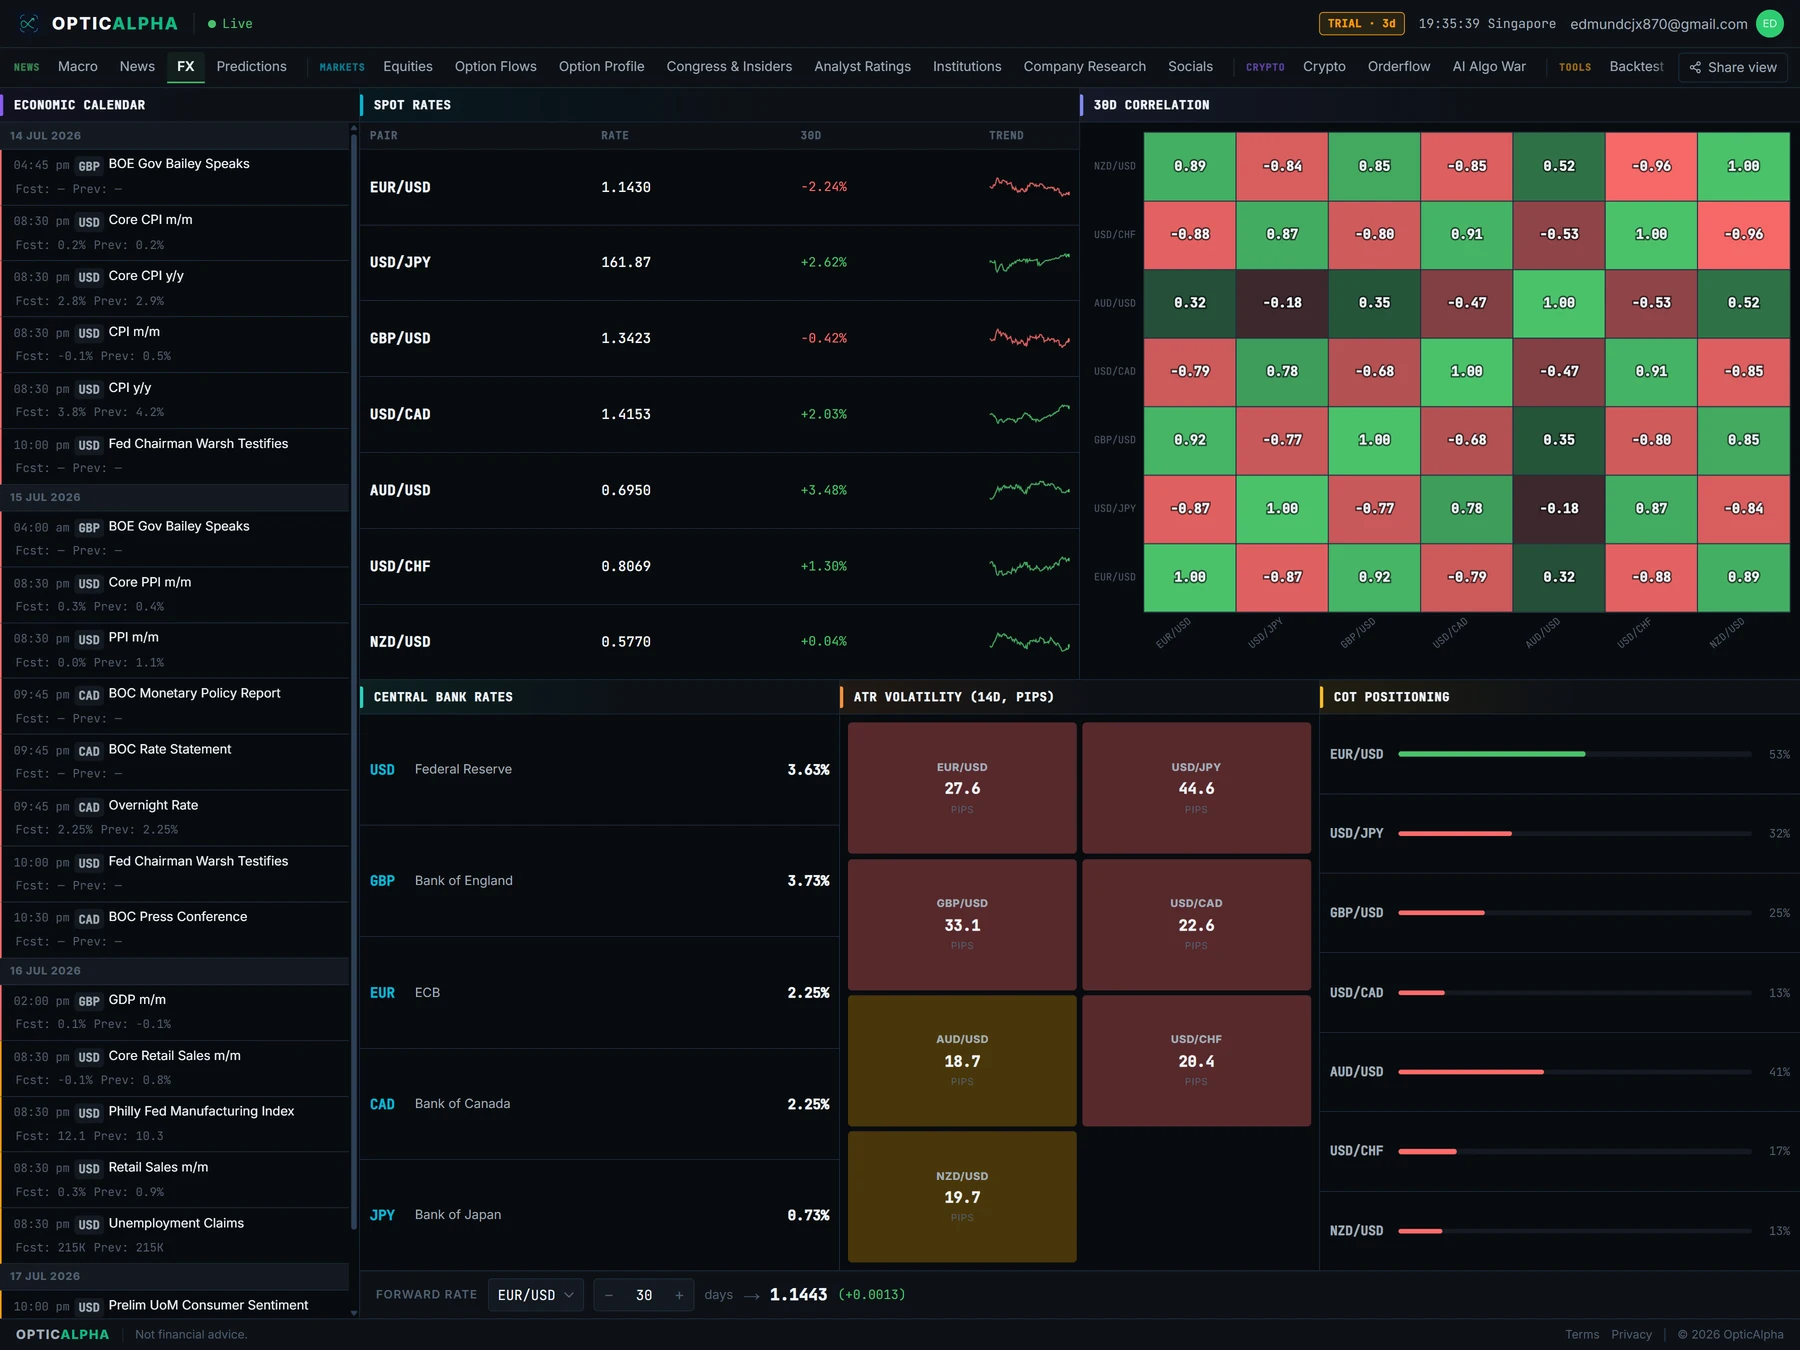
The Forex tab streams seven major pairs live: EUR/USD, USD/JPY, GBP/USD, USD/CAD, AUD/USD, USD/CHF, and NZD/USD. During market hours the rate table updates tick by tick rather than on a refresh timer, so you're watching the same prints a spot desk sees. Underneath each pair sits a 30-day sparkline built from daily closes, plus an ATR reading expressed as a percentage of spot so pairs trading at very different price levels can be sized against each other on equal footing.
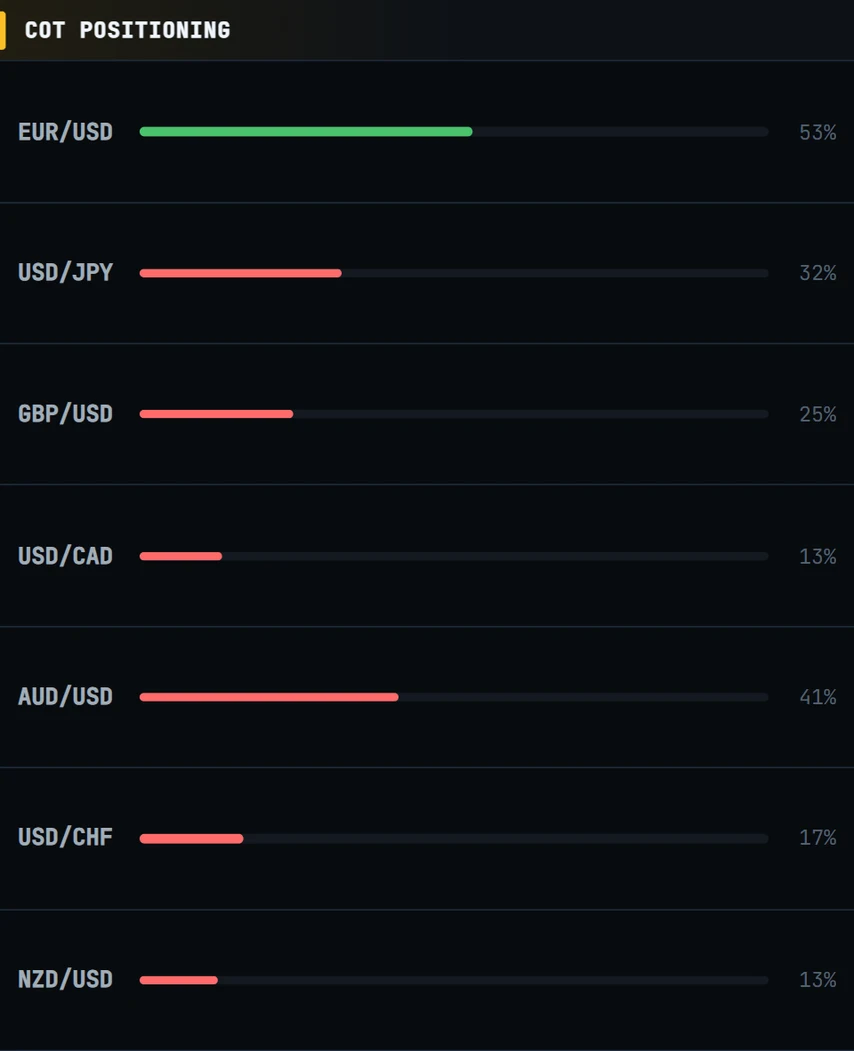
Positioning comes from the CFTC's weekly Commitments of Traders report. OpticAlpha pulls the non-commercial category, the large speculators rather than commercial hedgers, and turns their net futures position per currency into a horizontal bar: green when they're net long, red when they're net short, sorted so the most stretched reading sits at the top. A correlation matrix runs alongside it, built from the same 30 days of history, showing which pairs are moving together and which have decoupled.
Central bank rates round it out: current policy rates for the Fed, ECB, BOE, BOJ, and BOC, each with a stepped chart of its hike and cut history (Fed, ECB, BOE, and BOJ data comes from FRED; the BOC rate comes from the Bank of Canada's own Valet API, since FRED doesn't carry it). The economic calendar covers all eight FX-relevant currencies, USD, EUR, GBP, JPY, CAD, AUD, NZD, and CHF, wider in scope than the calendar on the news tab since every one of those currencies can move a pair here.
What OpticAlpha shows
7 live pairs
EUR/USD, USD/JPY, GBP/USD, USD/CAD, AUD/USD, USD/CHF, and NZD/USD stream tick by tick during market hours.
COT positioning
Weekly CFTC non-commercial net futures positioning per currency, sorted by how extreme the reading is. A crowded position reads as a contrarian setup, not a signal to follow.
ATR-based sizing
Average true range from the last 30 days of closes, shown as a percentage of spot so pairs at different price levels compare cleanly.
Central bank rates
Current policy rates for five major banks plus the hike and cut history behind each one, sourced from FRED and the Bank of Canada's Valet API.
The forex tab, in the terminal
How traders use this
Check the COT bar before you read the trend as gospel. A currency sitting at a net-long extreme means the large speculators who were going to buy already have, which caps how much fresh buying is left to push price further. That's not a reason to short immediately, it's a reason to size in more carefully and watch for the position to start unwinding, since crowded trades tend to reverse fast once they turn.
ATR sets a realistic target instead of a hopeful one. If EUR/USD's 30-day ATR works out to 60 pips, a 120-pip target is asking the pair to move roughly twice its normal daily range before you're proven right, so that trade needs a real catalyst behind it, not just a chart pattern. Sizing a stop or a target against ATR keeps expectations tied to how the pair actually behaves rather than how far you'd like it to move.
Central bank rates matter most for carry. Funding a position in a low-rate currency like the yen to hold a higher-rate currency like the Australian dollar earns the rate differential on top of any price move, which is one reason COT often shows crowded yen shorts: it's the funding leg of trades built elsewhere. When a central bank's stepped rate chart shows a cut coming, that funding math changes, and positioning that looked stable can unwind quickly.
Terms on this page
- Non-commercial position
- The CFTC's label for large speculators such as hedge funds and CTAs, as opposed to commercial hedgers. Their positioning is what the COT chart displays.
- Net long / net short
- The difference between a trader group's long and short futures contracts. A large net long in a currency means speculators are broadly betting it rises.
- ATR (Average True Range)
- A volatility measure derived from the size of daily price moves over a lookback window, here 30 days. Used to size positions and set realistic targets.
- Carry trade
- Borrowing a low-rate currency to fund a position in a high-rate one, profiting from the rate differential as long as the exchange rate holds roughly steady.
- Pip
- The smallest standard price move in a currency pair, typically the fourth decimal place (or second, for JPY pairs).
- COT extremes
- A situation where net positioning sits near a multi-year high or low. Historically associated with reversal risk, since most of the crowd that would trade in that direction has already done so.
Questions traders ask
What pairs does OpticAlpha track?
EURUSD, USDJPY, GBPUSD, USDCAD, AUDUSD, USDCHF, and NZDUSD, streamed live and updating tick by tick during market hours.
What is CFTC COT positioning?
A weekly report from the CFTC breaking down futures positioning by trader type. OpticAlpha shows the non-commercial (large speculator) net position for each currency, since that group's positioning tends to run in extremes before a reversal.
Why does the COT chart use bar length instead of a line?
Bar length shows the size of the net position at a glance, and sorting by magnitude puts the most stretched positioning at the top, where a contrarian read is likeliest to matter.
How is ATR calculated and why does it matter for sizing?
ATR comes from 30 days of daily closes. It's shown as a percentage of spot so pairs with different price levels are directly comparable, and it sets a realistic target size before entering a trade.
Where do central bank rates come from?
Fed, ECB, BOE, and BOJ rates come from FRED. BOC comes from the Bank of Canada's own Valet API, since FRED doesn't carry a reliable current series for it.
Related reading
Watch positioning before it flips
14-day free trial. No credit card required.
20+ live channels · $10.50/mo billed annually