The market's options positioning, aggregated
Put/call ratio, sector flow, index max pain, and the most active names, one tab up from single-name flow.
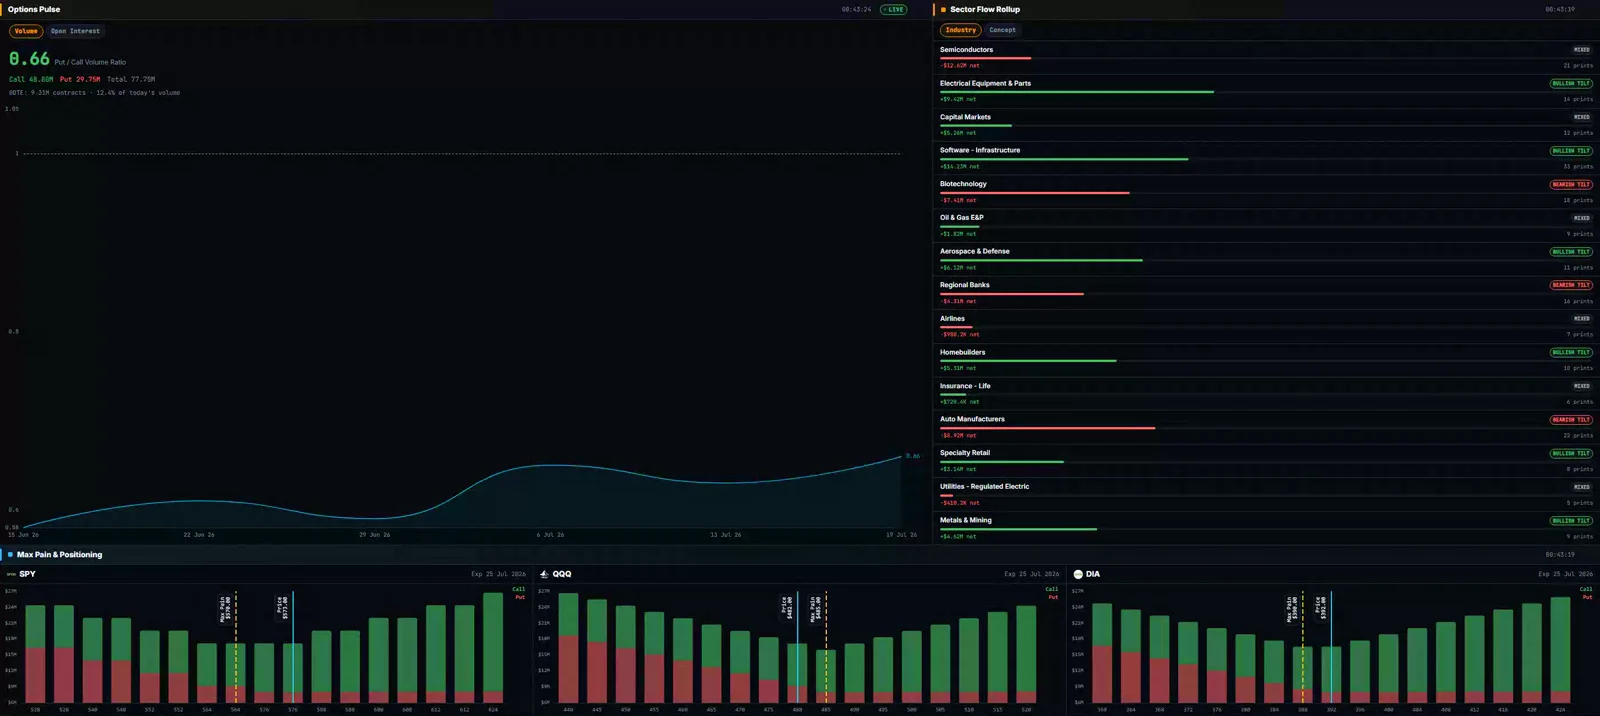 Real terminal UI · illustrative sample data
What is the Options Overview tab?
Options Flow shows you the tape for one ticker at a time, a sweep here, a block there, as it prints. Options Overview steps back and asks what the whole market is doing at once. It rolls every ticker's options activity into a handful of market-wide reads, one tab up from the single-name feed, so you can see whether traders across the board are leaning bullish or bearish before you go pick a specific name to trade.
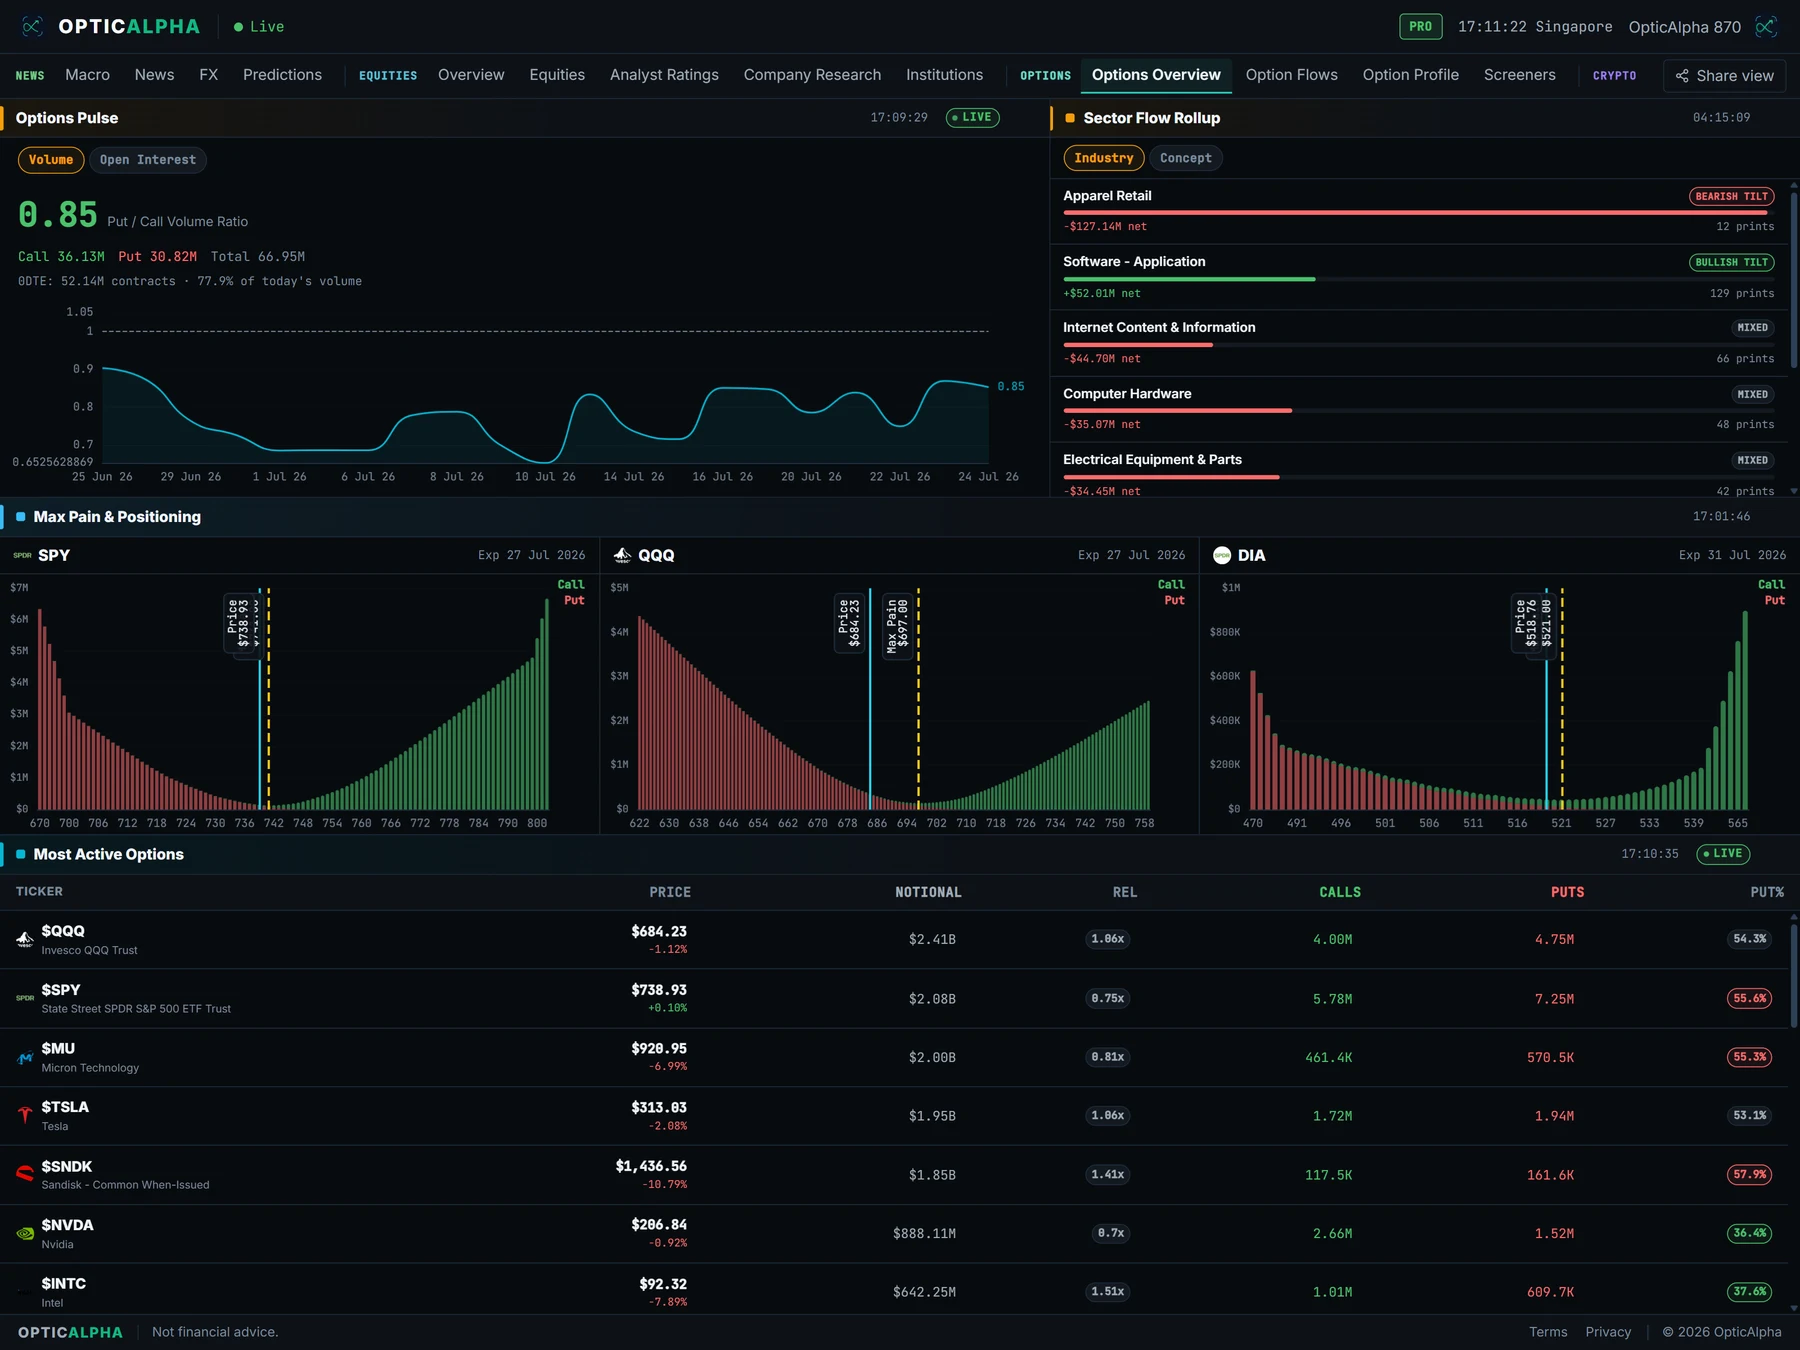
The core stat is put/call ratio, toggled between today's traded Volume and standing Open Interest. Get the direction right: it's Put divided by Call, not the reverse. A reading of 0.63 means calls are outtrading puts, the bullish-leaning side. A reading above 1.0 means puts are outtrading calls, the bearish-leaning side. Below that sits a Sector Flow Rollup, the same bullish and bearish premium split from the flow feed grouped by sector instead of by ticker, toggled between Industry classification and Concept, the thematic groupings like AI infrastructure that cut across sector lines.
A Max Pain & Positioning strip covers SPY, QQQ, and DIA specifically, not arbitrary tickers. Those three carry the deepest, most liquid options chains in the market, so their max pain levels reflect real aggregate positioning instead of a thin chain that a single large order can skew. Below that, a Most Active Options table ranks the day's top names by dollar notional, each row paired with relative notional and a PUT% skew reading, so a name that's genuinely unusually busy stands out from one that always trades heavy.
What OpticAlpha shows
Put/call ratio, Volume or OI
Toggle between today's traded volume and standing open interest to see the day's flow against the market's existing position.
Sector Flow Rollup
Bullish and bearish options premium grouped by sector, toggled between Industry classification and thematic Concept plates.
Max Pain & Positioning
SPY, QQQ, and DIA only, the three deepest chains in the market, so the levels reflect real aggregate positioning.
Most Active Options
Top names by dollar notional, with relative notional and PUT% skew so genuinely unusual activity stands out from routine heavy volume.
The market's options positioning, at a glance
How traders use this
Put/call ratio works best next to single-name flow, not instead of it. A sweep buying calls in one ticker tells you what one trader thinks. A market-wide ratio sliding toward 0.5 while that sweep prints tells you the crowd is leaning the same direction, which is a different, sturdier kind of evidence than either signal reads alone.
The sector rollup answers a question the flow feed alone can't: which corner of the market is actually getting the options bets today, not just which single stock. A cluster of bullish premium across a handful of related tickers, flagged the same way under Concept, is a sector-wide lean worth noticing even if no individual name on the flow feed looks unusual by itself.
Max pain on SPY, QQQ, and DIA is context for expiration week, not a rule to trade against. Price gravitating toward a max pain level into a Friday close is a real, observed pattern, but it's a lean, not a guarantee, so treat it as one input alongside whatever else the week is doing. On the most active table, relative notional is what separates the two kinds of busy: a name trading well above its own normal pace is behaving differently today, while a name like SPY that always carries heavy volume needs a much bigger move in raw dollars before it means anything unusual.
Terms on this page
- Put/call ratio
- Puts traded divided by calls traded (or open) for the whole market. Above 1.0 skews bearish and below 1.0 skews bullish. Getting this backwards is a common mix-up.
- Open interest (OI)
- The number of options contracts outstanding, as opposed to volume, which counts today's trades. OI reflects standing positioning; volume reflects today's flow.
- Sector flow rollup
- Bullish versus bearish options premium aggregated by sector or thematic grouping, instead of by individual ticker.
- Max pain
- The strike where the total value of expiring options contracts is lowest for buyers and highest for sellers. Often acts as a price gravity point into expiration.
- Relative notional
- Today's dollar options flow in a name compared against its own normal average, so a stock running well above its usual pace stands out even if it isn't the single largest name in raw dollars.
Questions traders ask
Is the ratio shown Call/Put or Put/Call?
Put/Call. A reading of 0.60 means calls are outtrading puts roughly 5-to-3, generally the bullish-leaning side. A reading above 1.0 means puts are outtrading calls, the bearish-leaning side. Toggle between Volume (today's traded contracts) and Open Interest (contracts outstanding) to see the day's flow against the market's standing position.
What is the Sector Flow Rollup?
The same bullish/bearish premium split from the options flow feed, grouped by sector instead of by ticker. Toggle between Industry (traditional sector classification) and Concept (thematic groupings like AI infrastructure) to see which corners of the market options traders are actually leaning on today.
Why only SPY, QQQ, and DIA for max pain?
Those three carry the deepest, most liquid options chains in the market, so their max pain levels reflect real aggregate positioning rather than a thin, easily-skewed chain. Max pain for any individual ticker is available on-demand from the Option Profile tab.
What counts as a most active option?
The top names ranked by total dollar notional traded that day, shown with relative notional (today's flow against the name's own normal average), call and put volume split, and PUT% skew, so you can separate a name that is genuinely busy from one that always trades heavy.
How often does this tab update?
Put/call ratio and the sector rollup update through the session as new flow prints in. Max pain and the most active table refresh on a scheduled poll roughly every 15 minutes, since a full max-pain recompute needs the whole options chain, not just the newest print.
Related reading
See the market's options positioning
14-day free trial. No credit card required.
20+ live channels · $10.50/mo billed annually