Cross-Asset Volatility Stress Gauge
One number for global market stress, built from 16 markets and ranked against each market’s own last 12 months.
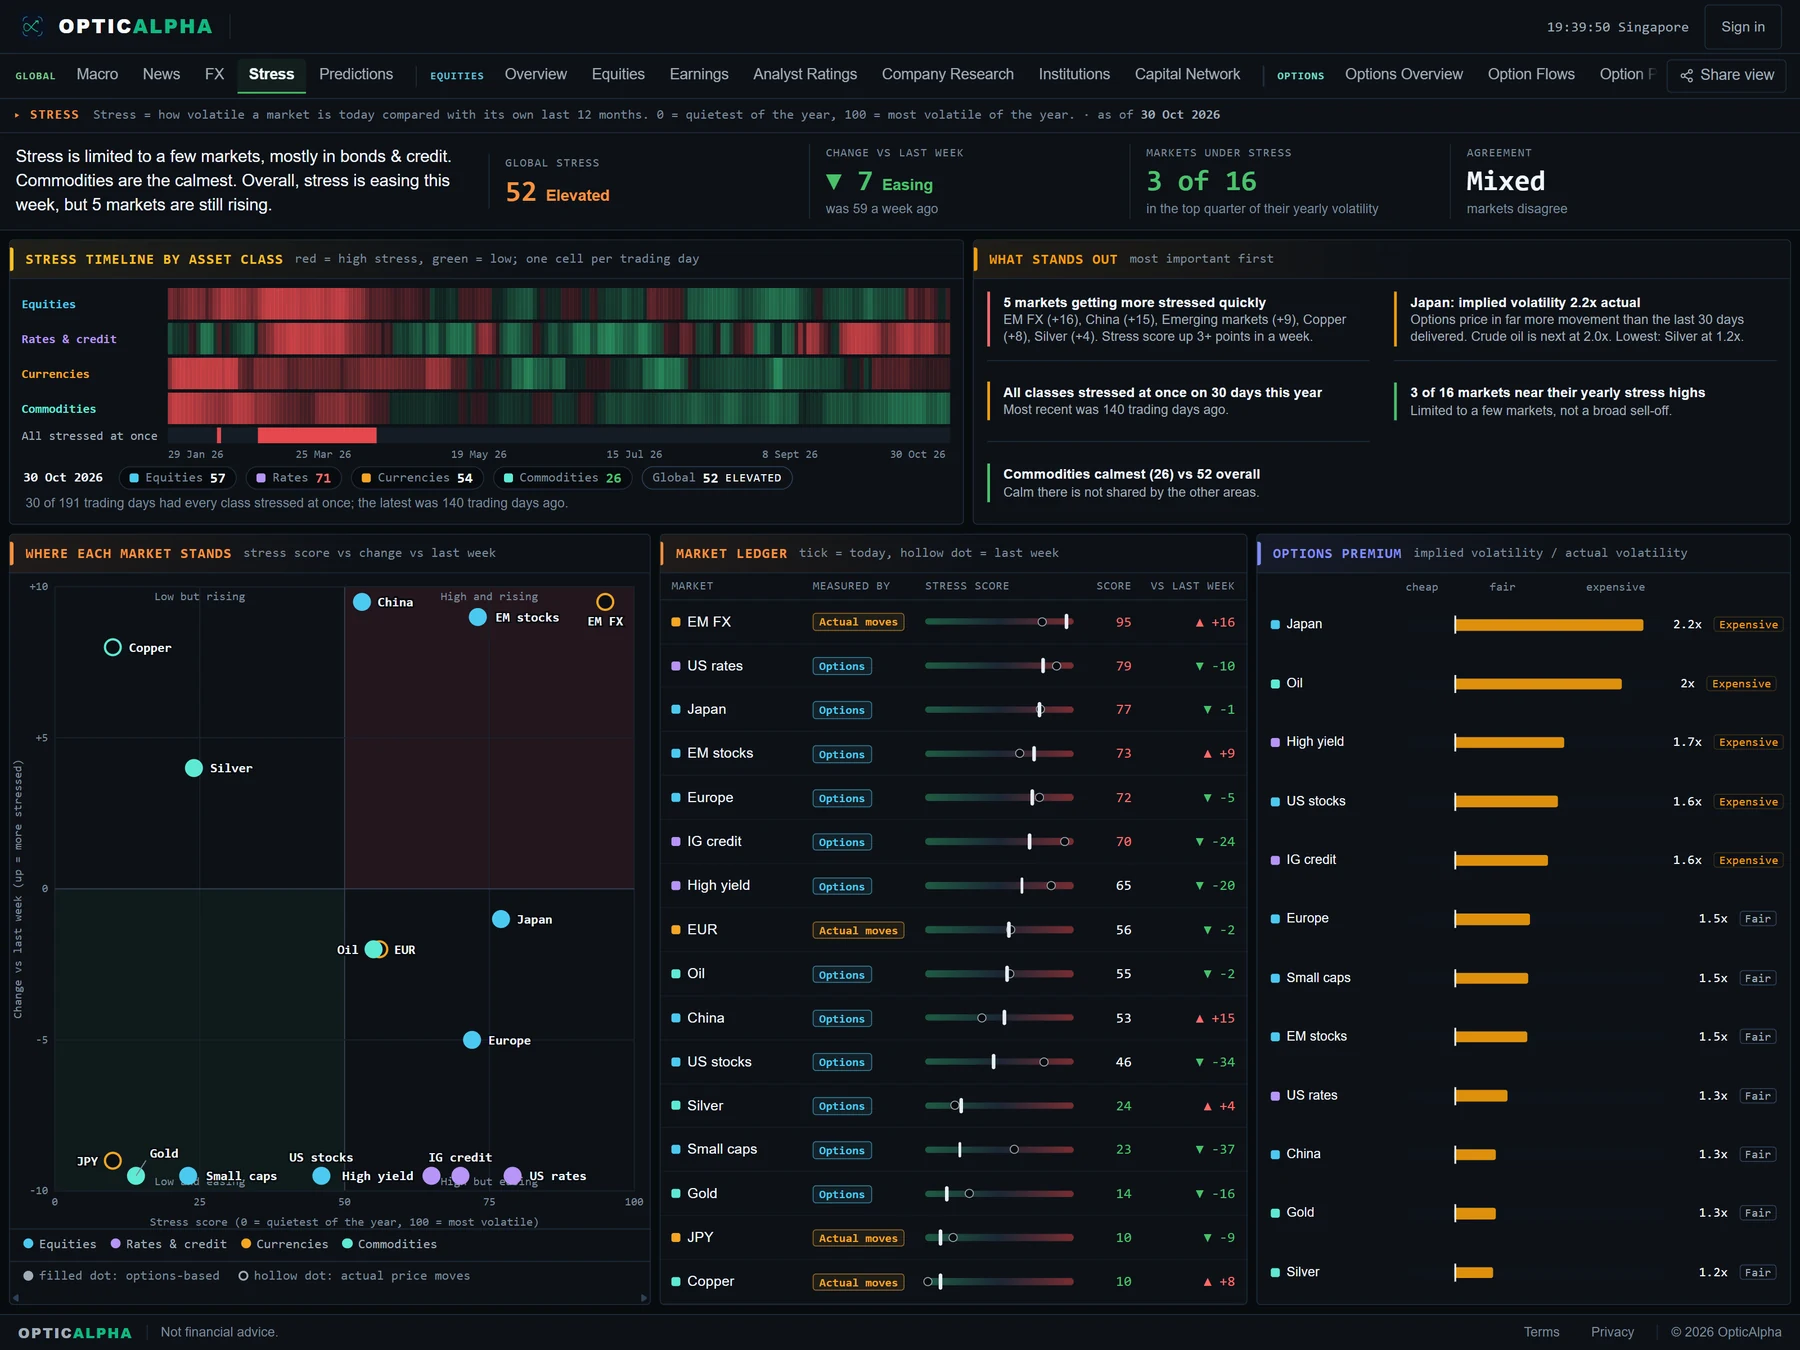
Preview of the Stress tab · illustrative sample data
What is the Stress tab?
Stress sits in the Global group of the terminal and answers one question: how nervous are markets right now, compared with what is normal for each of them? It covers 16 markets in four classes: equities, rates and credit, currencies, and commodities. For every market it takes today's volatility and ranks it against that market's own last 12 months. The result is a stress score from 0 to 100, where 0 is the quietest reading of the year and 100 is the most volatile. Higher always means more stress.
Ranking each market against its own history is what makes the markets comparable. Oil and US rates move in very different ranges, so a raw volatility number tells you little across them. A percentile does: 90 means "about as volatile as this market has been all year", whatever the market. The four classes are then blended with equal weight into one global stress score, and a band word makes it readable at a glance: Low, Moderate, Elevated or High. The tab also shows the score over 1-month, 3-month, 6-month and 1-year windows.
Where a market has liquid options, its score uses implied volatility, the movement options prices expect. Where it does not, the score uses realized volatility, the movement that has actually happened, and the ledger labels which is which. Everything is derived and shown as scores; the tab updates once a day after the US close, so it always reflects the last completed session rather than a live feed.
What OpticAlpha shows
One global stress score
A 0-100 headline with a Low, Moderate, Elevated or High band, the change versus last week, how many of the 16 markets are under stress, and whether they agree or disagree.
Stress timeline by asset class
One strip per class with a cell per trading day, red for high stress and green for low, plus a strip that lights up on days when every class was stressed at once.
Stress matrix
Every market plotted by stress score against its change versus last week, split into four quadrants: low but rising, high and rising, low and easing, high but easing.
Market ledger
All 16 markets ranked by stress score, with whether each is measured from options prices or actual moves, a marker for today and one for last week, and the weekly change.
Options premium
Implied volatility divided by actual volatility for the options-priced markets, labelled Cheap, Fair or Expensive, so you can see where options price in far more movement than has happened.
What stands out
Plain-language flags generated from the numbers by fixed rules, most important first: fast risers, the biggest options premium, days when everything was stressed together. No AI commentary.
The Stress tab, in the terminal
How traders use this
Start with the agreement tile and the timeline. A global score of 55 built from a few markets at 95 and the rest near 20 is a very different market from one where everything sits at 55. When the "all stressed at once" strip lights up, risk is moving as one trade across equities, bonds, currencies and commodities, which is what a broad risk-off looks like. When stress is confined to one class, it is more often a local story.
Use the matrix to see direction, not just level. A market in the high-and-rising quadrant is getting more stressed from an already elevated reading. A market that is high but easing may be calming after a spike. The ledger's last-week marker shows the same thing market by market, and the what-stands-out flags surface the fastest risers without you scanning all 16 rows.
The options premium panel compares what options are pricing with what has actually happened. When implied volatility runs well above the last 30 days of actual movement, options are expensive relative to recent history, which matters if you are buying them. When the ratio sits close to 1, options are priced in line with recent movement. As with any volatility measure, a high stress score says conditions are turbulent, not which way price goes next. This is information, not financial advice.
Terms on this page
- Stress score (volatility percentile)
- Where a market's volatility today ranks against its own last 12 months, from 0 (quietest of the year) to 100 (most volatile of the year). Higher means more stress.
- Implied volatility (IV)
- The level of future price movement an option's current price implies, expressed as an annualized percentage.
- Realized volatility
- How much a market has actually moved over a recent window, measured from its past price changes. The backward-looking counterpart to implied volatility.
- Volatility risk premium (options premium)
- The gap by which implied volatility typically exceeds the volatility that follows. Shown here as implied divided by actual volatility: above 1 means options price in more movement than has recently occurred.
- Market breadth
- How many markets or stocks are participating in a move. Here, how many of the 16 markets sit in the top quarter of their own yearly volatility.
Questions traders ask
What does the stress score mean?
It ranks how volatile a market is today against its own last 12 months. 0 means the quietest reading of the year, 100 means the most volatile reading of the year. Higher always means more stress, in every cell, class and headline number on the tab.
Which markets are covered?
Sixteen markets in four classes: equities (US, small caps, Europe, Japan, China, emerging markets), rates and credit (US rates, high yield, investment-grade credit), currencies (EUR, JPY, emerging-market FX) and commodities (oil, gold, silver, copper). The classes are blended with equal weight so the equity markets cannot outvote everything else.
What is the difference between implied and realized volatility here?
Where a market has liquid options, the score uses implied volatility, the movement options prices are pricing in. Where it does not, the score uses realized volatility, how much the market has actually moved. The ledger labels each market "Options" or "Actual moves" so you always know which one you are reading.
What is the options premium panel?
For markets with options, it divides implied volatility by actual (realized) volatility over the last 30 days. Above 1 means options are pricing in more movement than has recently happened. That gap is the volatility risk premium; the panel labels readings Cheap, Fair or Expensive.
How often does it update, and is it real time?
No. It is an end-of-day tool. The scores are recomputed once per trading day after the US close, so the tab always shows the latest completed session and displays its as-of date. It describes conditions, it does not predict them, and it is not financial advice.
Related reading
See how stressed markets are today
14-day free trial. No credit card required.
20+ live channels · $10.50/mo billed annually