The Market.
One Terminal.
Every Signal.
Access options flow, gamma exposure (GEX), crypto liquidation maps, CFTC COT forex data and 18 FRED macro indicators, all in one browser terminal.
Ready to trade smarter?
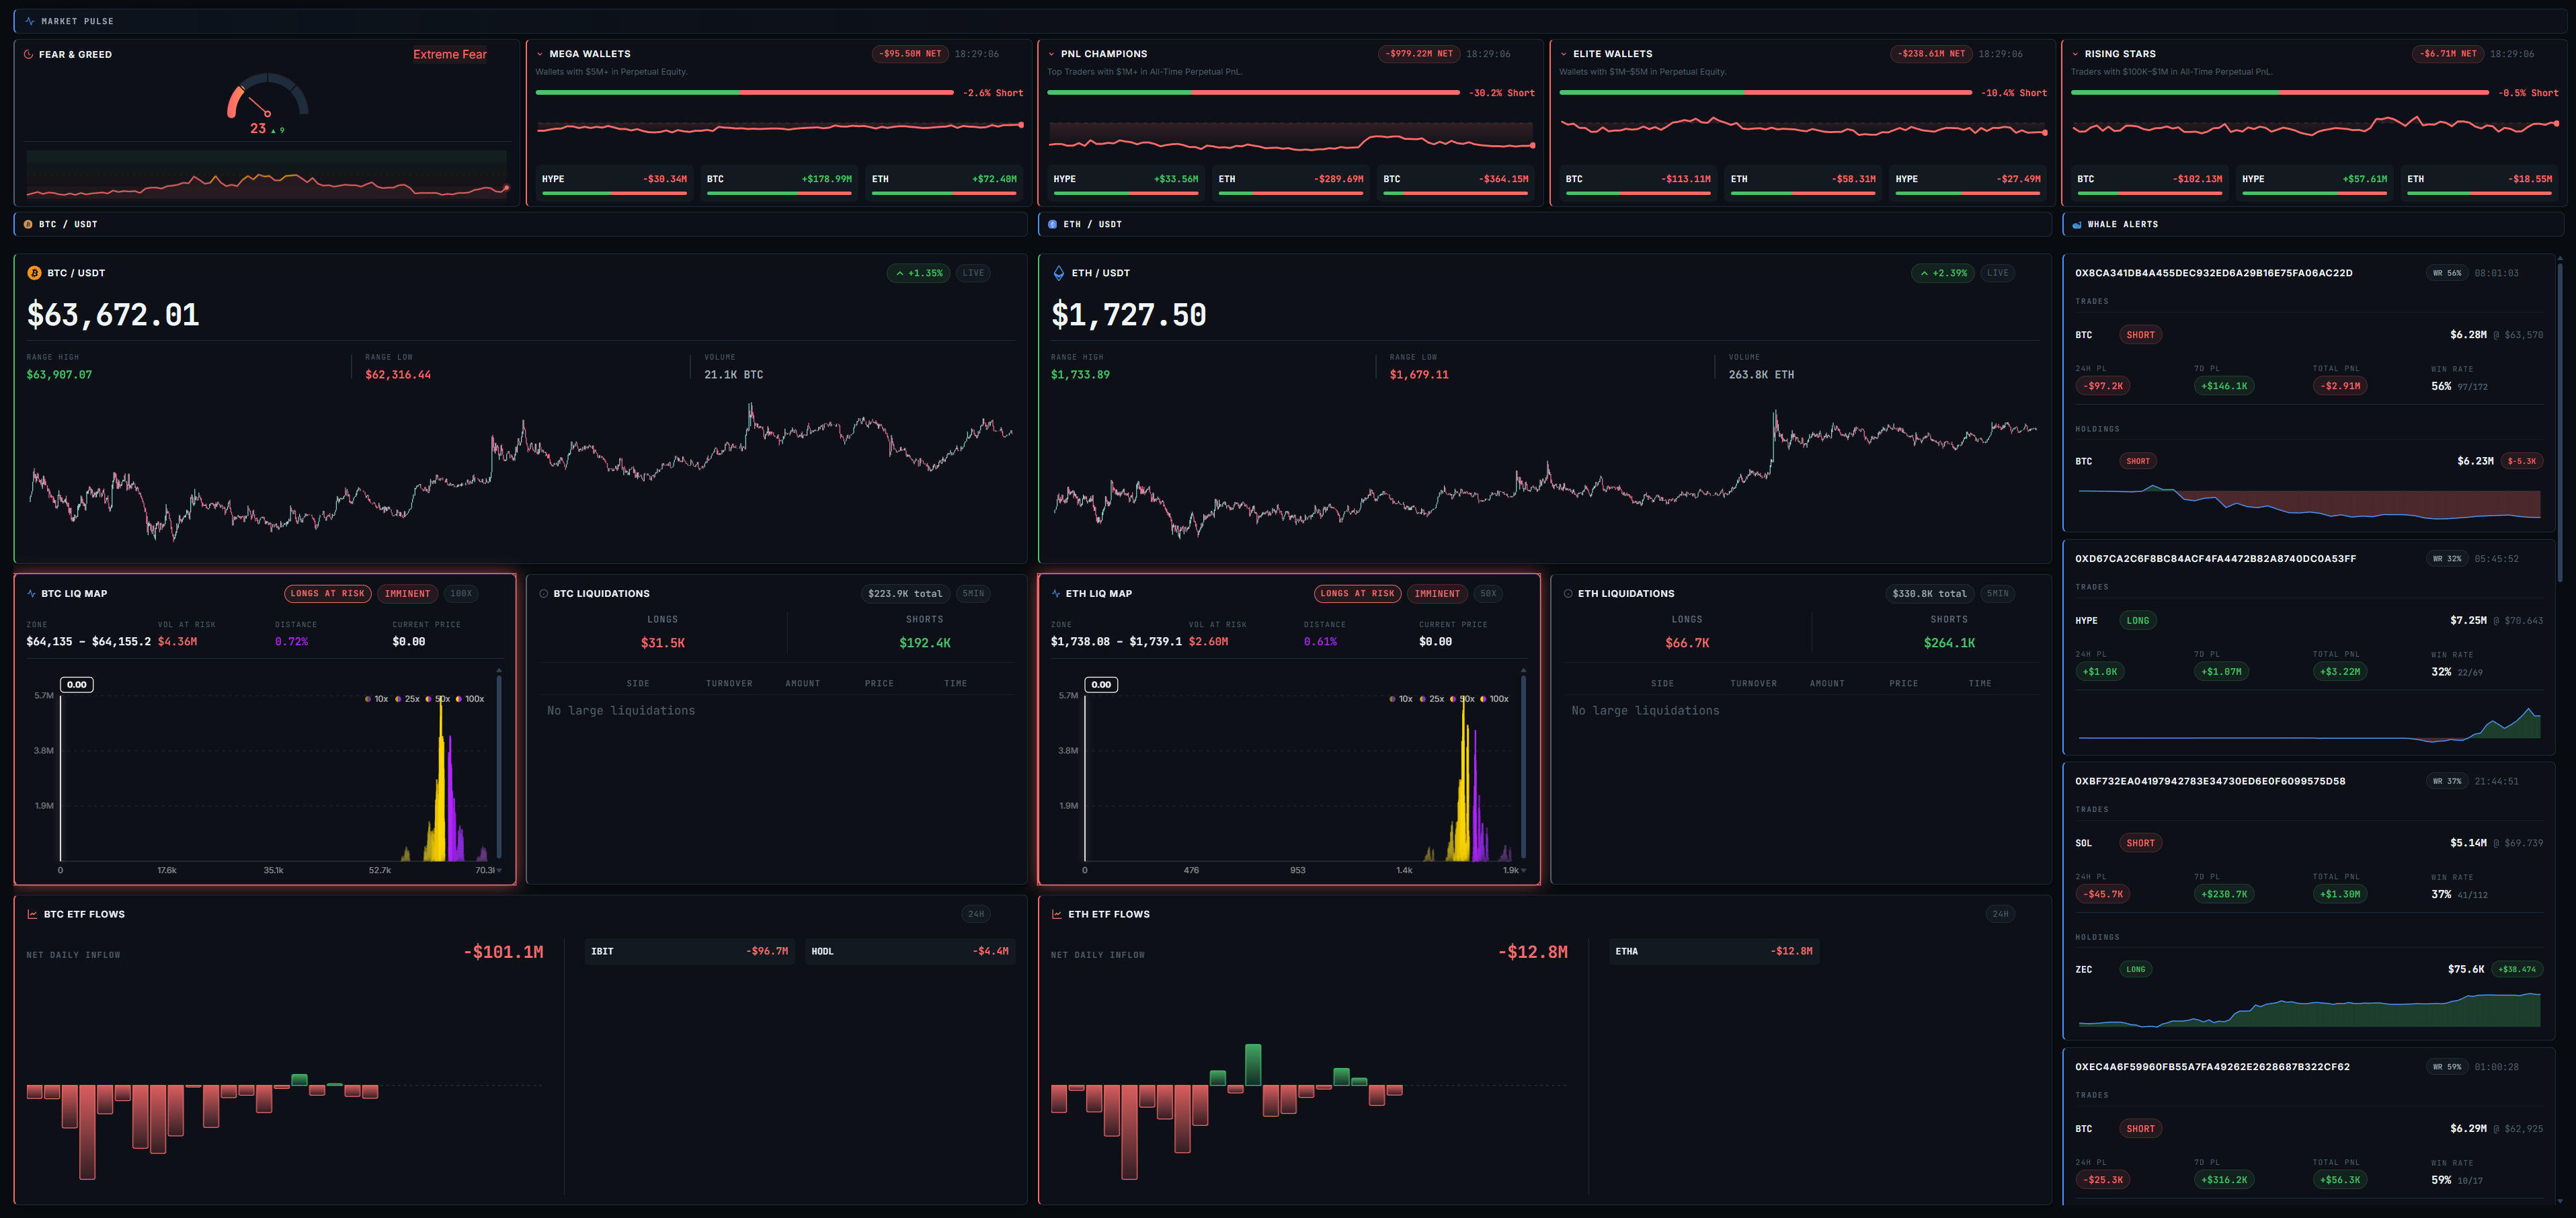
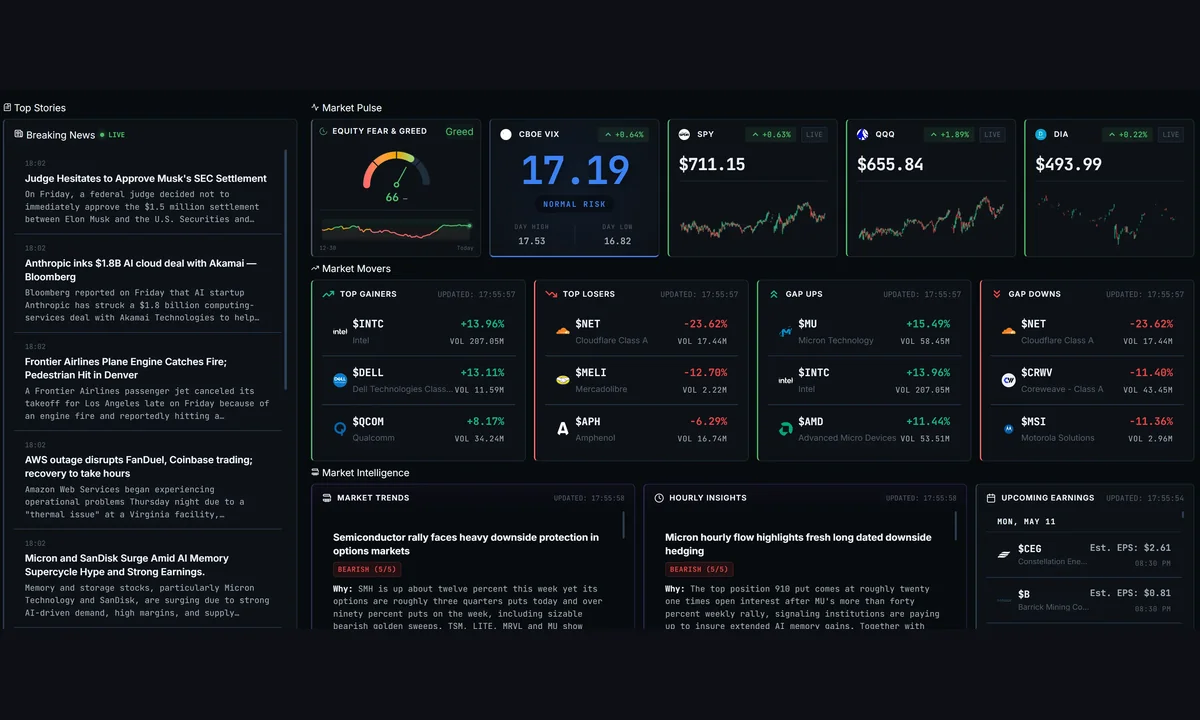
Live data. Not a mockup.
Real-time prices across equities, crypto and forex, from the same feeds that power the full terminal.
12 live channels: options flow, GEX, crypto, forex, macro and more
Options flow, gamma exposure (GEX), crypto liquidation maps, CFTC COT forex and 18 FRED macro indicators, all in one workspace.
Why options traders, crypto traders and macro traders use OpticAlpha
Specific prices, named sources, and coverage broad enough to replace most traders' existing toolstacks.
5 asset classes. Under $15/mo. No one else does this.
Live forex COT, crypto liquidation maps, options GEX, and 18 FRED macro indicators in one workspace. Options flow tools run $48/mo. Macro data adds another $39/mo. OpticAlpha covers all of it.
Primary sources, direct to your terminal.
Form 4 insider trades direct from SEC EDGAR: all qualifying filings, not a curated subset. Data arrives within SEC's own processing time, with no aggregator layer added.
No lock-in, no annual trap.
Go month to month at $15/mo, or save on the annual plan. Every plan opens with a 14-day free trial and no credit card to start. Cancel anytime from your account.
Traders who ditched the tab stack
Options desks, crypto day traders, macro swing traders. One terminal replaces all of it.
The GEX map alone justified the subscription. Seeing where dealers are positioned before a squeeze sets up is something I was paying $48/mo for elsewhere, in worse form.
The liquidation heatmap shows where stop-runs are stacked before price gets there. I caught the BTC long wipeout at $67K twenty minutes early. Nothing else showed it.
COT data, yield curve and FedWatch in one view is genuinely useful. I used to switch between four tabs to build the same picture. Now it's one terminal, one login.
One terminal instead of a stack of subscriptions
The tools most traders pay for separately, covered by a single login.
Prices are each tool's listed rate, shown to compare scope. Billed annually at $126, or $15/mo on the monthly plan.
- All 12 live channels, 5 asset classes
- 14-day free trial, no credit card
- Runs in any browser, nothing to install
- Cancel anytime, no lock-in
Common questions about OpticAlpha
What is gamma exposure (GEX) and why does it matter for options traders?
Gamma exposure (GEX) measures how much delta hedging dealers must do as price moves through different strike levels. A large positive GEX level acts as a price magnet. OpticAlpha's GEX profile shows net dealer exposure by strike in real time, alongside a squeeze radar that scores each setup from 0 to 100 on flow, positioning and momentum.
How do crypto liquidation maps work?
Liquidation maps show where leveraged long and short positions are clustered across major exchanges. When price reaches a cluster, those positions are force-closed, accelerating the move. OpticAlpha pulls BTC and ETH liquidation heatmap data continuously so traders can see where the next stop-run is likely to accelerate.
What is CFTC COT data and how is it used in forex trading?
The CFTC Commitments of Traders (COT) report, published weekly, shows net futures positioning by non-commercial traders across currency pairs. Extreme net-long or net-short readings often precede mean-reversion moves. OpticAlpha displays COT positioning for all seven major pairs alongside live FX rates and a correlation matrix.
What does OpticAlpha cost?
OpticAlpha costs $10.50 per month on the annual plan ($126 billed annually) or $15 per month on the monthly plan. Every plan starts with a 14-day free trial and no credit card is required to begin.
Do I need to install anything?
No. OpticAlpha runs entirely in your browser. Open the terminal from any modern desktop browser with no downloads, plugins, or software installation required.
What asset classes and channels does OpticAlpha cover?
OpticAlpha covers five asset classes across 12 live channels: US equities (live movers, analyst ratings, company research, congressional and insider filings), options (unusual flow, gamma exposure GEX, max pain, expected move), crypto (liquidation maps, whale alerts, CVD orderflow, fear and greed), forex (seven major pairs live, CFTC COT positioning, central bank rates, correlation matrix) and global macro (US Treasury yield curve, 18 FRED indicators, Fed funds futures, economic calendar).
Stop assembling a toolstack. Start the trial.
12 live channels. 5 asset classes. 14 days free. No credit card required.